Bar Graphs - Lesson for Grade 2, Chapter - Keeping Track of Data
In this engaging lesson on Bar Graphs, designed specifically for 2nd-grade students, learners will embark on an exciting journey into the world of data representation. This lesson falls under the chapter "Keeping Track of Data" within the unit "Foundations and Applications in Measuring, Time and Data." Through a series of interactive activities, including Alien Math: Bar Graphs, Bar Graphs Worksheet, How Many Brothers and Sisters? Worksheet, and Park Math: Bar Graph Worksheet, students will master the art of organizing and interpreting information through bar graphs.
Understanding bar graphs is crucial for young learners as it lays the foundation for their data literacy. By learning how to create and read bar graphs, students will develop their ability to analyze information, make comparisons, and draw conclusions. These skills are not only fundamental in mathematics but are also applicable in everyday life. Whether it's understanding sports statistics, comparing the number of rainy days across months, or making informed decisions based on data, the knowledge gained from this lesson will empower students with the tools they need to navigate the world of information with confidence and ease.

-
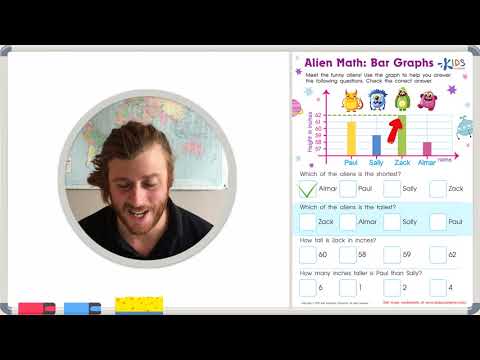
Activity 1 / Alien Math: Bar Graphs
-
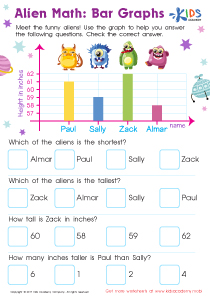
Activity 2 / Bar Graphs Worksheet

Let’s blast off to outer space to visit our funny alien friends with this bar graphs worksheet PDF!
Not only will your child practice comparing the colorful aliens by size, but he or she will gain valuable practice working with bar graphs, increasing important measurement and data analysis skills! -
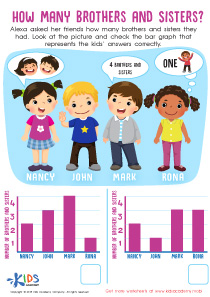
Activity 3 / How Many Brothers and Sisters? Worksheet
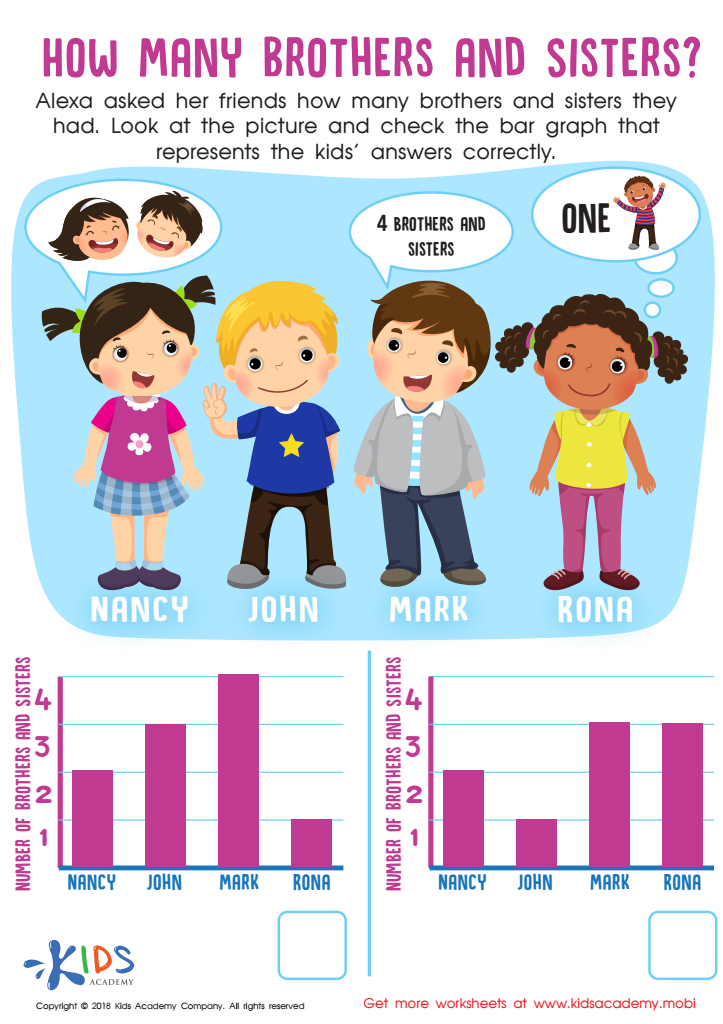
Can your child tell you how many siblings their friends have? Can they tell you? In this worksheet, Alexa has asked her friends how many brothers and sisters they have. Her friends have given her different answers, as shown in the picture. Ask your child to carefully look at the picture and use it to check the bar graph that represents Alexa’s friends’ answers correctly.
-
Activity 4 / Park Math: Bar Graph Worksheet
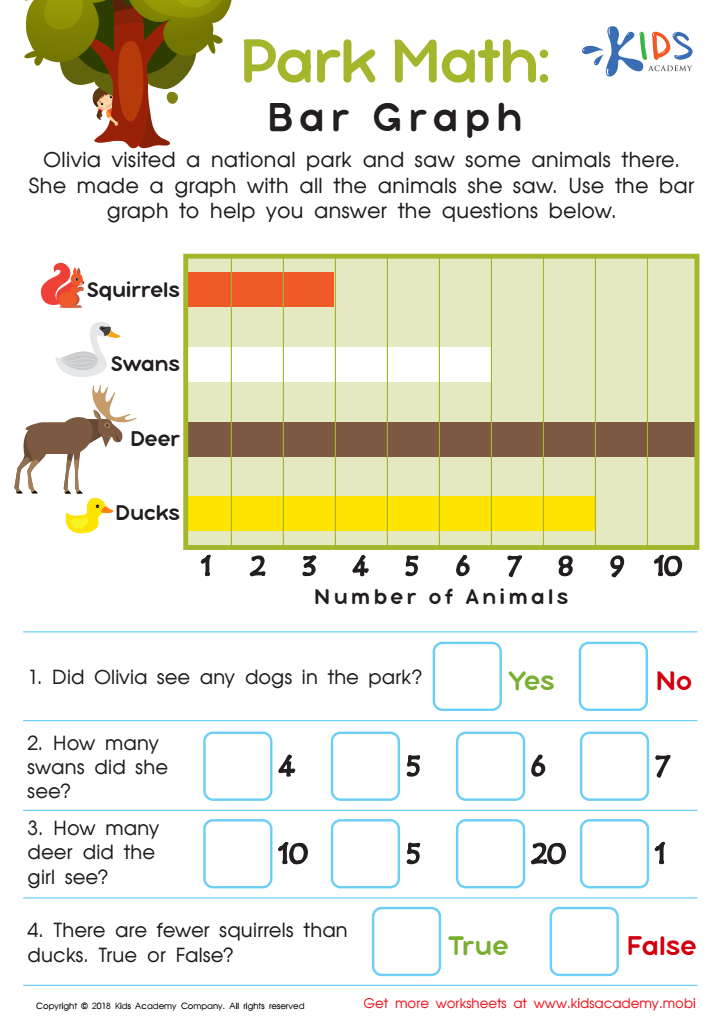
Do your kids love the park? How often do you visit, and can they tell you some of the animals they are particularly fond of at the park? In this worksheet, your kids will be introduced to Olivia who has just visited a National Park and saw some animals there. Olivia made a graph with all the animals she saw to help her give proper account. Ask your child to use the bar graph to help them answer the questions given down below.