Interpreting data Graphs Worksheets for Ages 3-8
3 filtered results
-
From - To
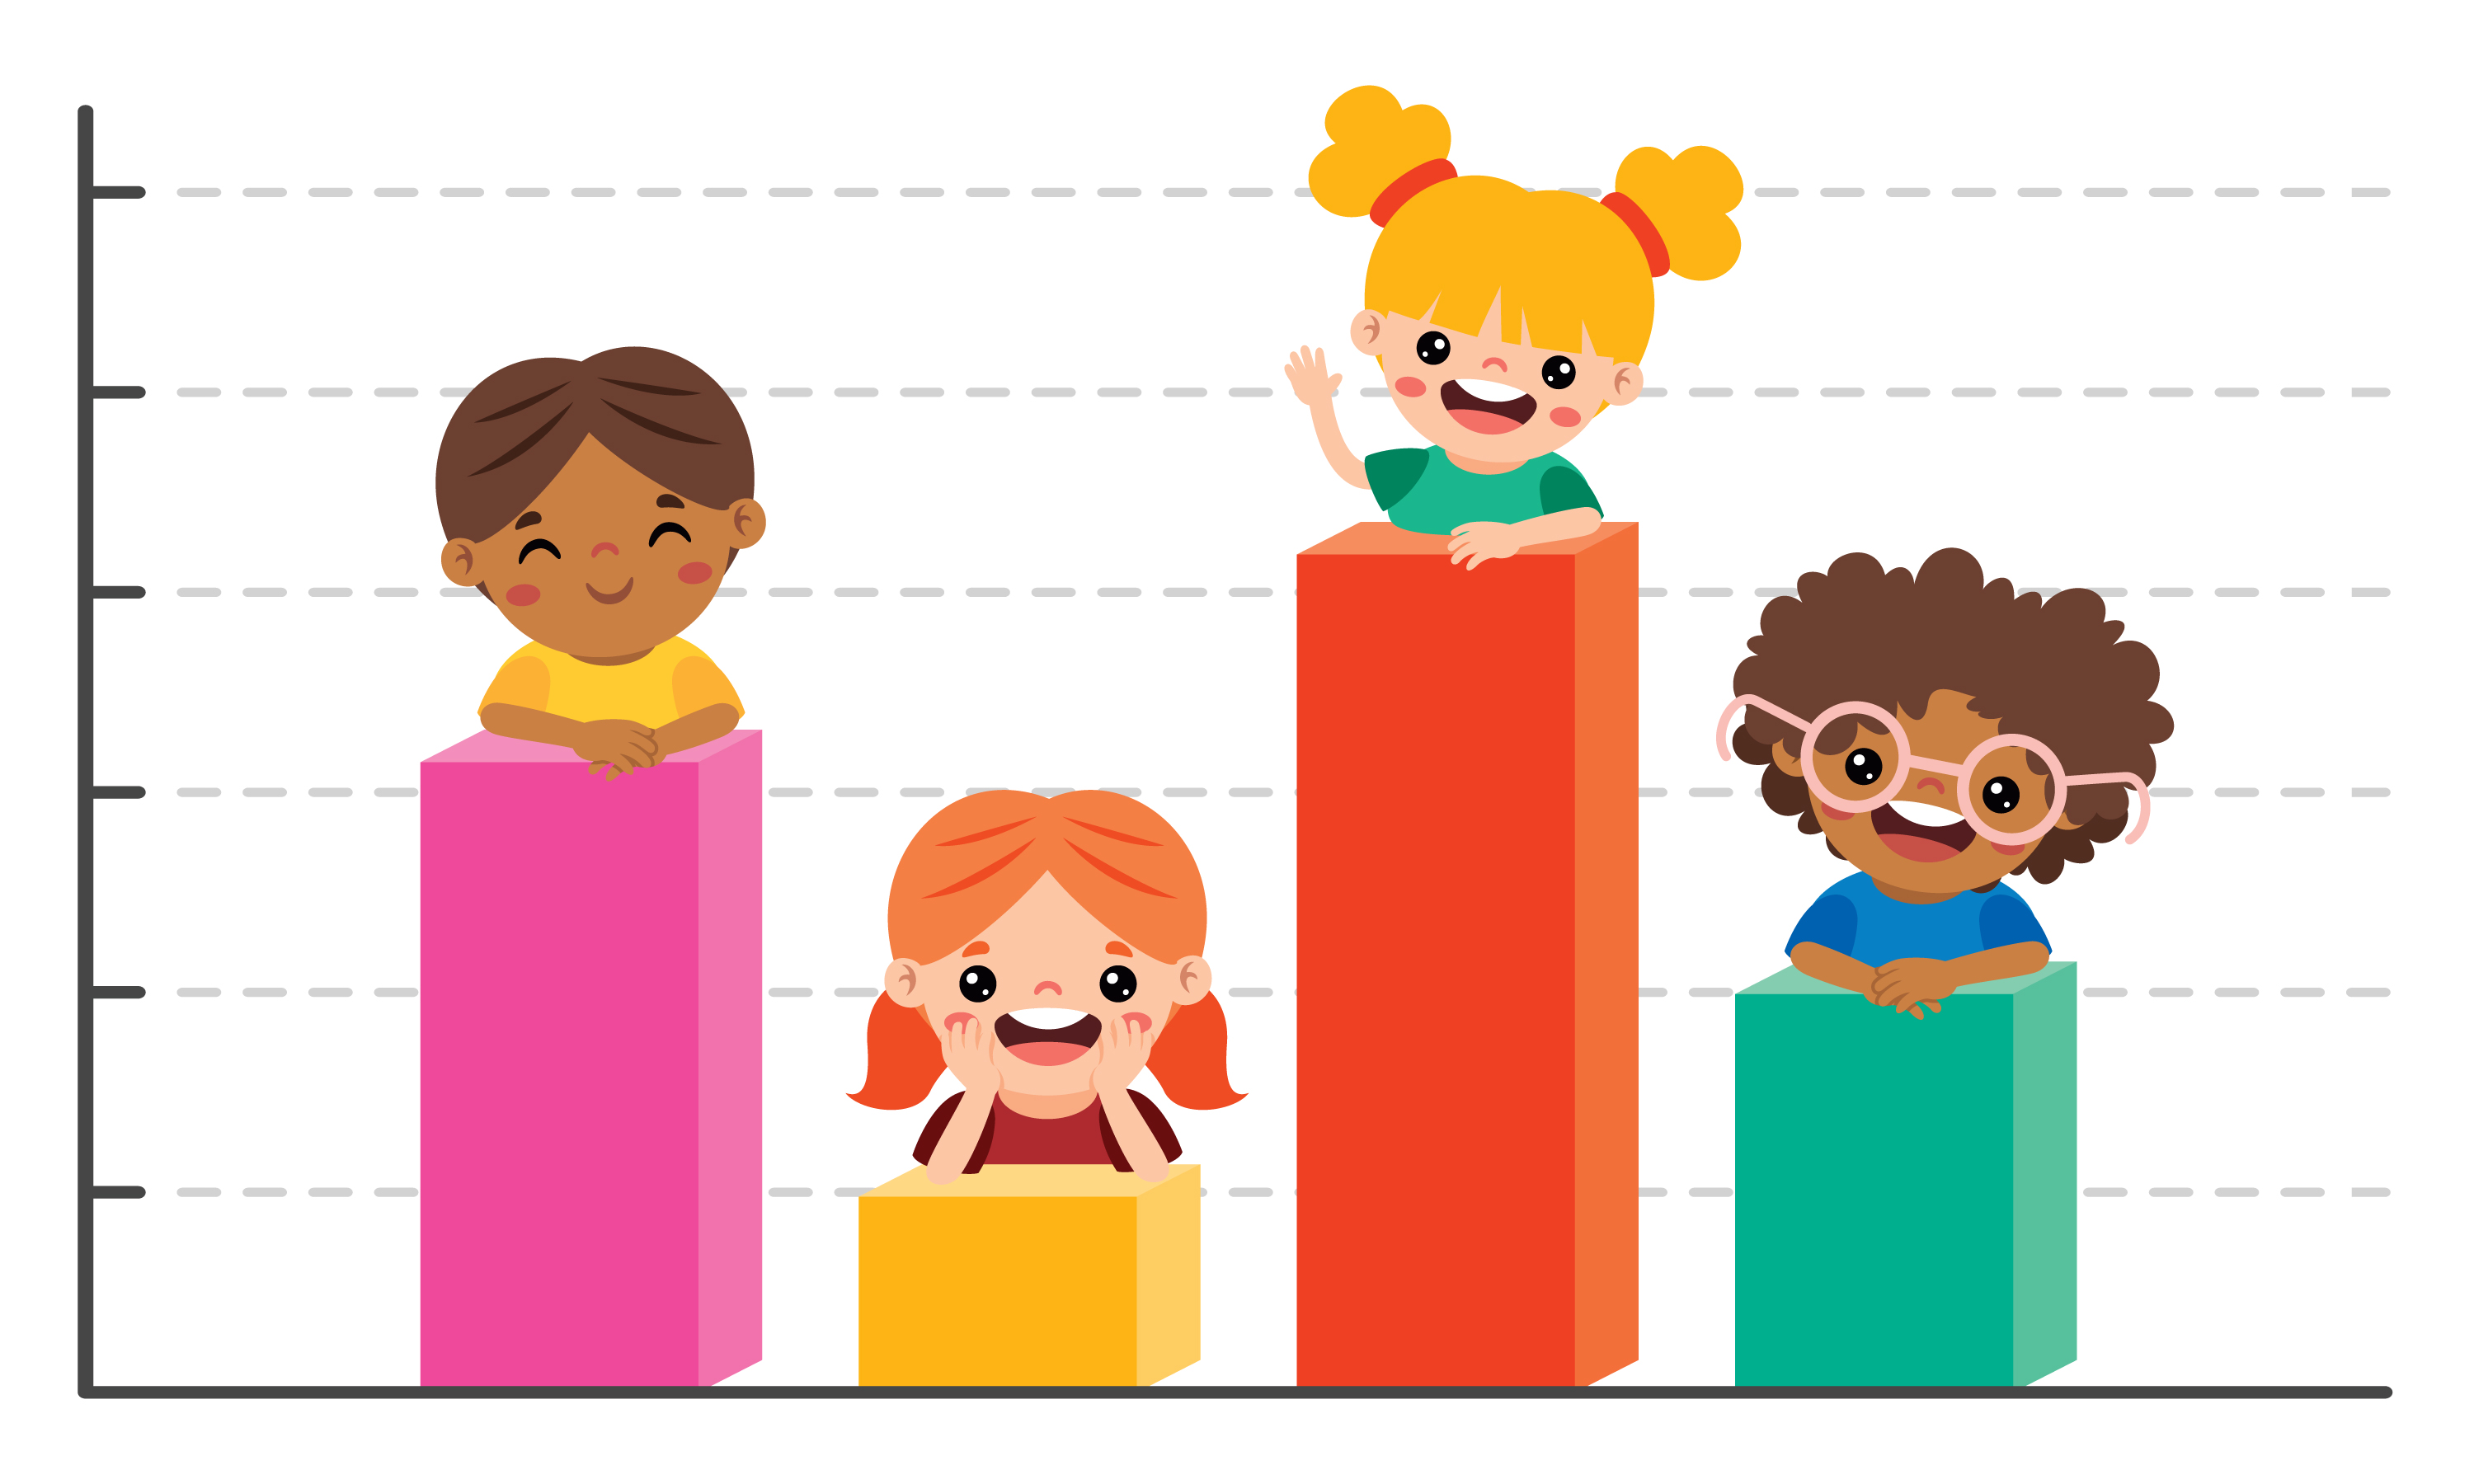
Our "Interpreting Data Graphs Worksheets for Ages 3-8" are specially designed to make data education fun and engaging for young learners. These worksheets aim to develop foundational skills in understanding bar graphs, pictographs, and other data representations. Perfect for early grade students, the activities encourage analytical thinking and improve their ability to interpret and compare information visually. Each worksheet offers colorful, child-friendly images and practical exercises tailored for gradual skill development. Enhance your child's math capabilities with our expertly crafted resources, available to print and use anytime at home or in the classroom!
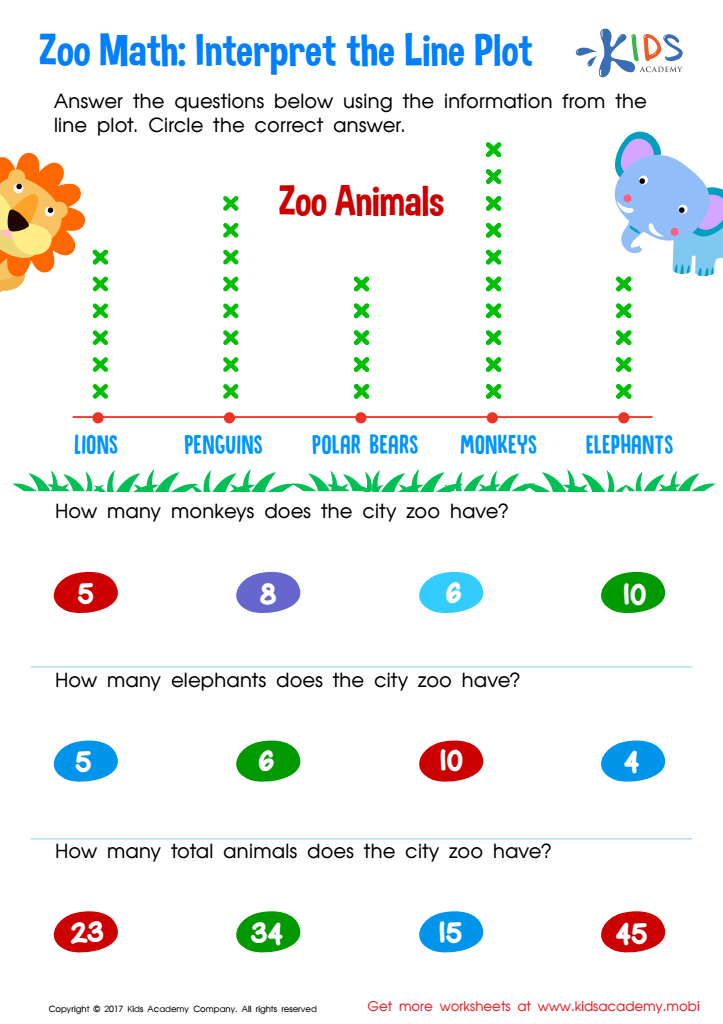

Interpret Line Plot Worksheet
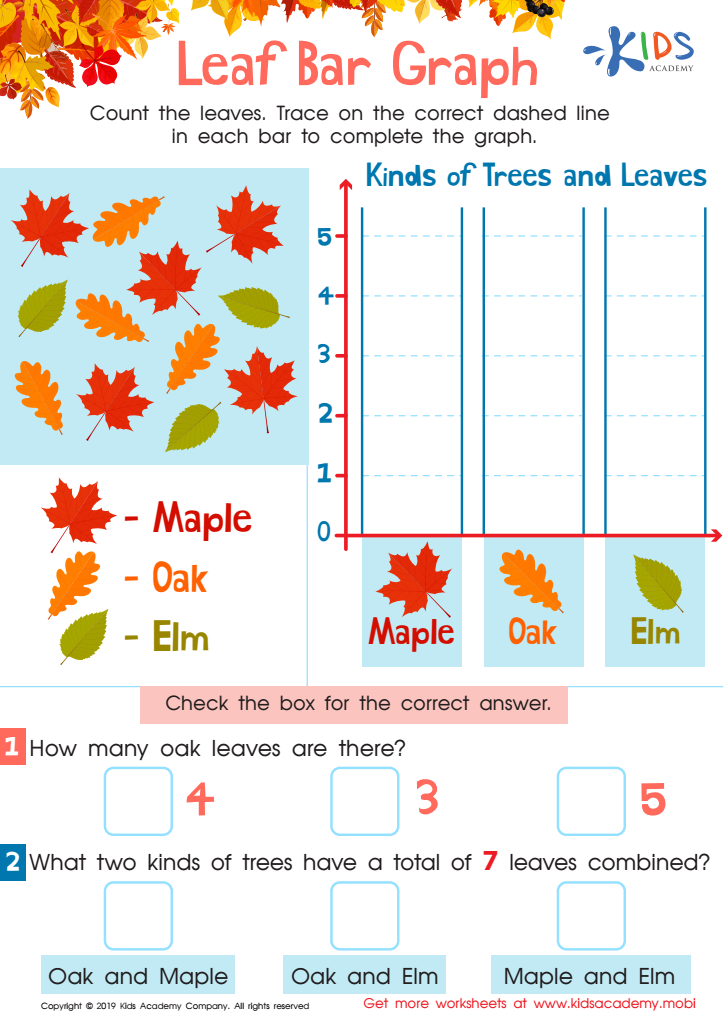

Leaf Bar Graph Worksheet
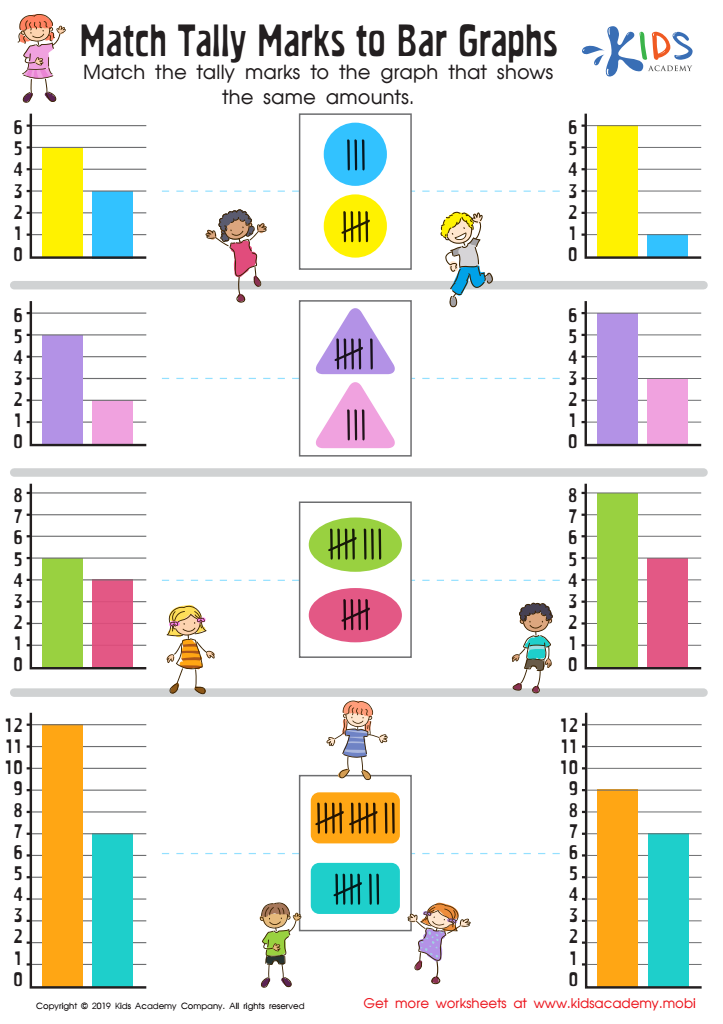

Match Tally Marks to Bar Graphs Worksheet
Interpreting data graphs is a crucial skill for young children aged 3-8 as it lays the foundation for critical thinking, problem-solving, and analytical abilities. Graphs help children visualize information, making abstract concepts tangible and easier to understand. For parents and teachers, nurturing this skill at an early age can yield long-term educational benefits.
Firstly, understanding data graphs enhances mathematical literacy. Children learn to recognize patterns, compare quantities, and make informed predictions. These skills are fundamental not just in math, but across many subjects, including science and social studies. For example, children interpreting a bar graph of weather patterns can better grasp the concept of seasons.
Secondly, exposure to data representation aids cognitive development. Interpreting graphs involves processes such as reasoning, logical thinking, and attention to detail. These mental exercises are incredibly valuable, helping children develop a structured way of thinking that is beneficial in everyday decision making.
Lastly, data interpretation encourages active learning and curiosity. Children engage more deeply with subjects when they can visualize problems and solutions. This fosters a sense of accomplishment and motivates them to explore further. By prioritizing graph interpretation skills, parents and teachers equip children with tools to navigate an increasingly data-driven world, promoting lifelong learning and adaptability.
 Assign to My Students


