Understanding bar graphs Sight Words Worksheets for Ages 4-9
3 filtered results
-
From - To
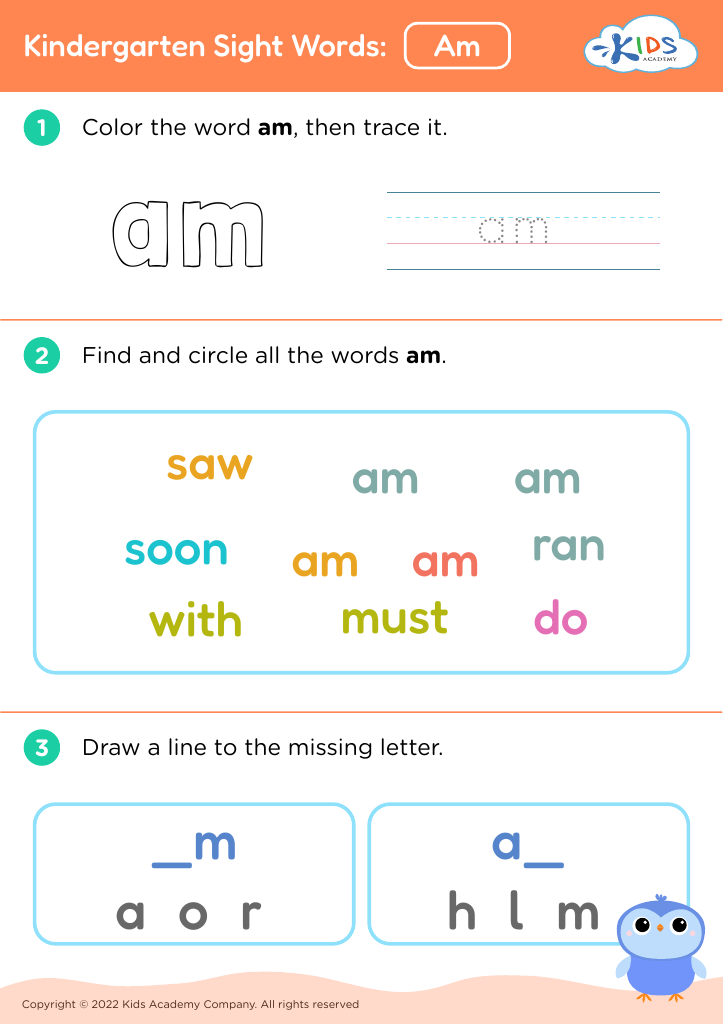
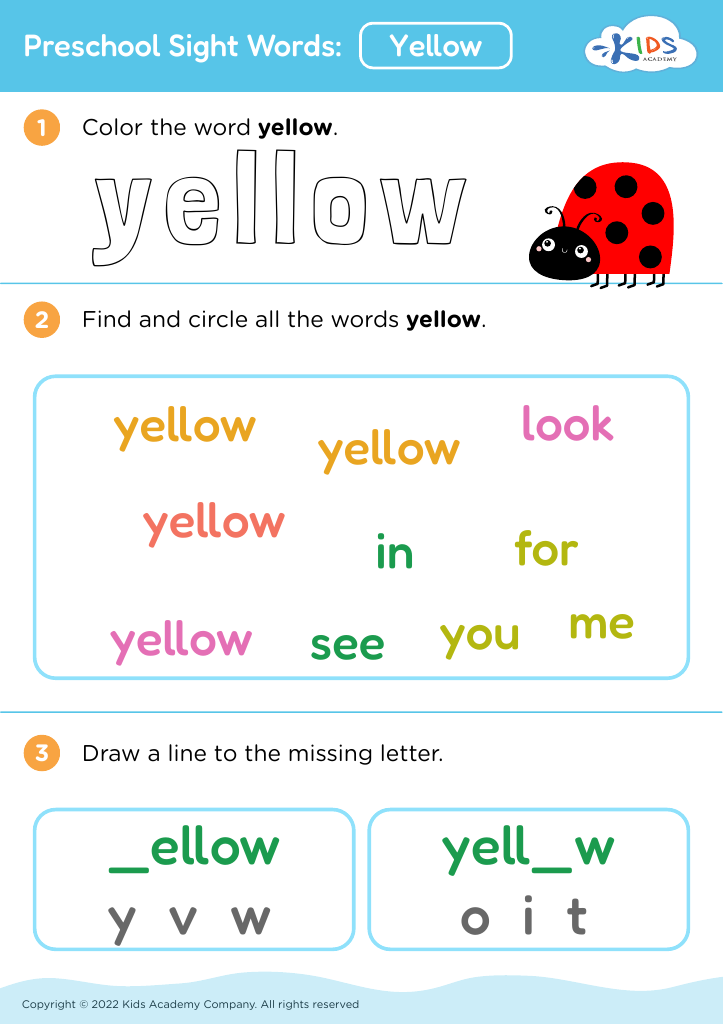
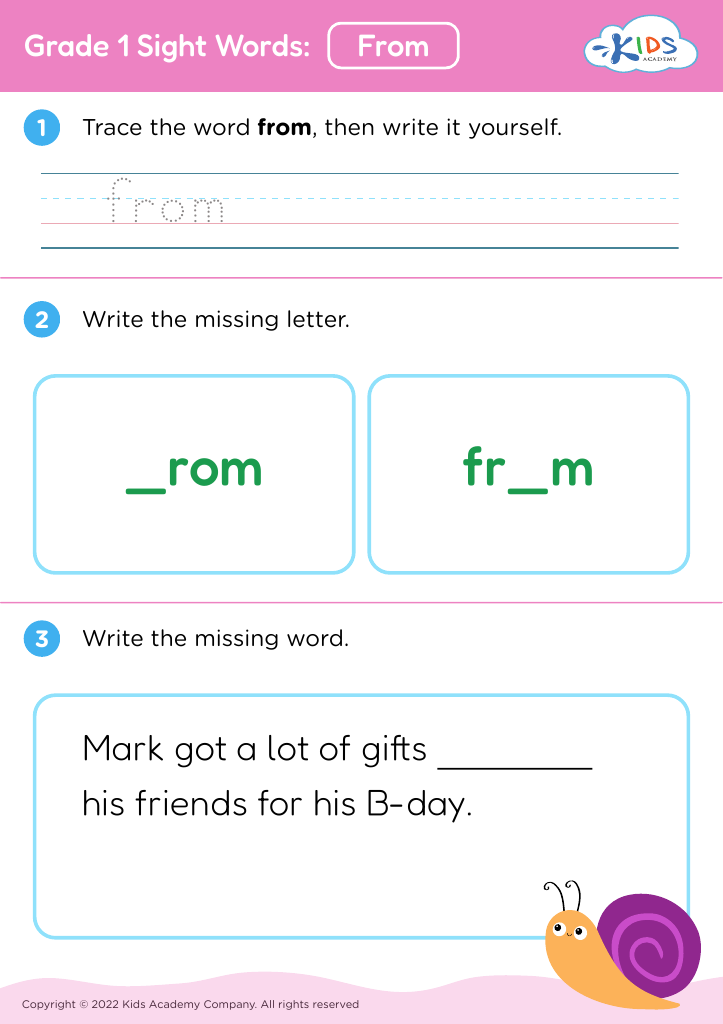
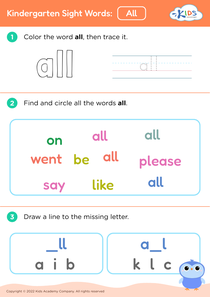
Enhance your child's reading and comprehension skills with our "Understanding Bar Graphs Sight Words Worksheets" designed specifically for ages 4-9. These engaging worksheets combine the learning of sight words with the introduction of bar graphs, a fundamental math concept. Children will improve their vocabulary while developing their ability to interpret data visually. Each worksheet is crafted with vibrant illustrations and easy-to-follow instructions, ensuring a fun and interactive learning experience. Perfect for at-home practice or classroom use, these resources foster critical thinking and reinforce early literacy. Start your child's journey to understanding graphs today while building essential sight word knowledge!
Understanding bar graphs is a crucial skill for young learners, particularly for children aged 4-9. Parents and teachers should prioritize this knowledge for several reasons. Firstly, bar graphs provide a visual representation of data, helping children grasp the concept of quantitative information in a format that is easy to interpret. This foundational skill enhances their ability to compare quantities, recognize patterns, and make informed decisions based on data.
Moreover, bar graphs are often encountered in everyday situations, such as in school projects, food recommendations, or sports statistics. Teaching students how to read and create bar graphs fosters critical thinking and analytical abilities, which are essential in later academic pursuits and real-life scenarios.
Additionally, linking bar graphs to sight words helps children develop their vocabulary and literacy skills. By integrating these two learning areas, educators can create a rich learning environment that promotes comprehension and retention.
Incorporating bar graphs into learning also prepares students for standardized testing and assessments that include data interpretation. Ultimately, equipping children with the ability to understand bar graphs lays the groundwork for informed citizenship, as data literacy is increasingly vital in today's data-driven world, empowering them to participate actively and responsibly in society.
