Understanding graphs Numbers Worksheets for Ages 6-7
3 filtered results
-
From - To
Explore our "Understanding Graphs Numbers Worksheets" designed specifically for children aged 6-7. These engaging resources help young learners grasp the fundamentals of data representation through colorful and interactive graphs. Students will develop essential skills as they interpret simple bar charts, pictographs, and line graphs, encouraging critical thinking and analytical abilities. Our worksheets facilitate hands-on practice, allowing children to understand how to compare sets of data visually. Perfect for home or classroom use, these activities foster a love for math while building a strong foundation in graph literacy. Start your child's journey to mastering graphs today!
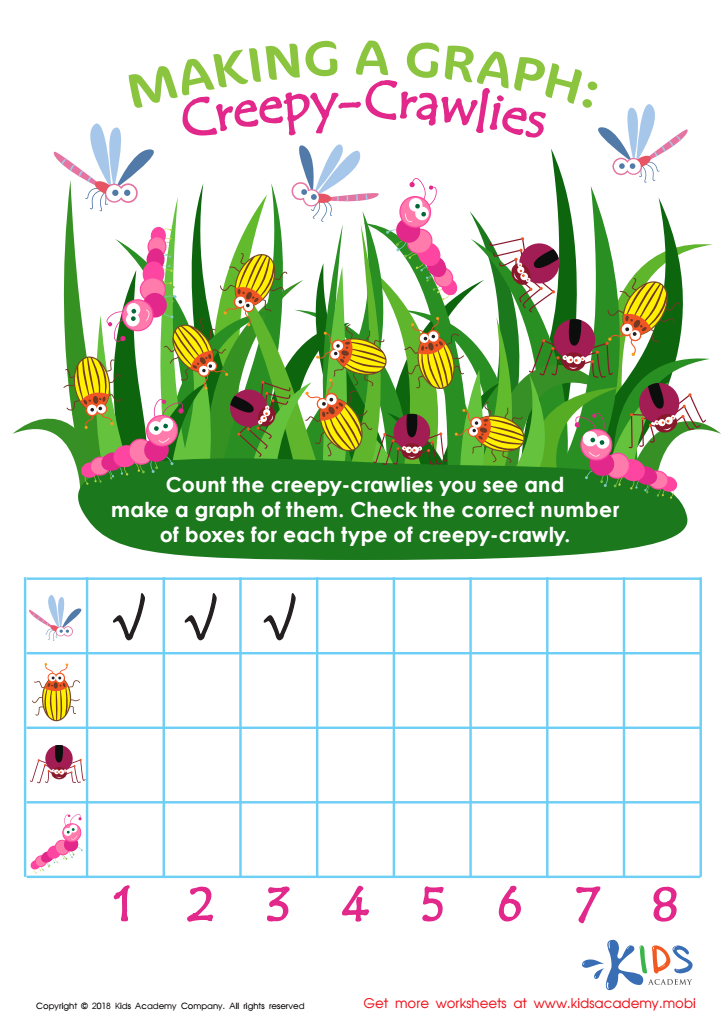

Making a Graph: Creepy Crawlies Worksheet
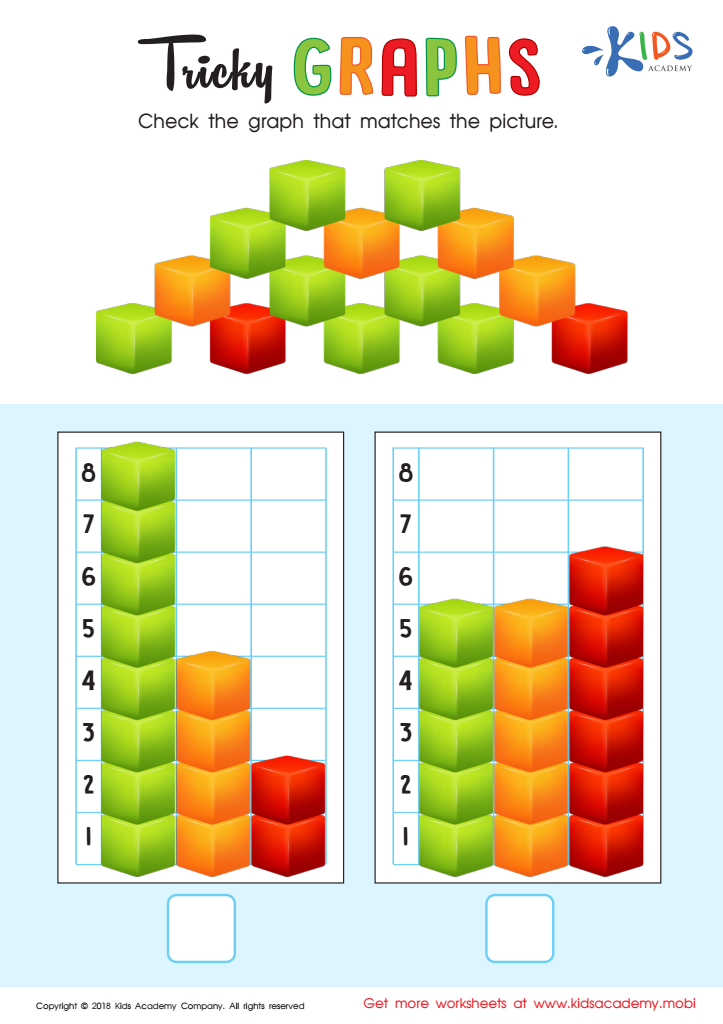

Tricky Graphs Worksheet
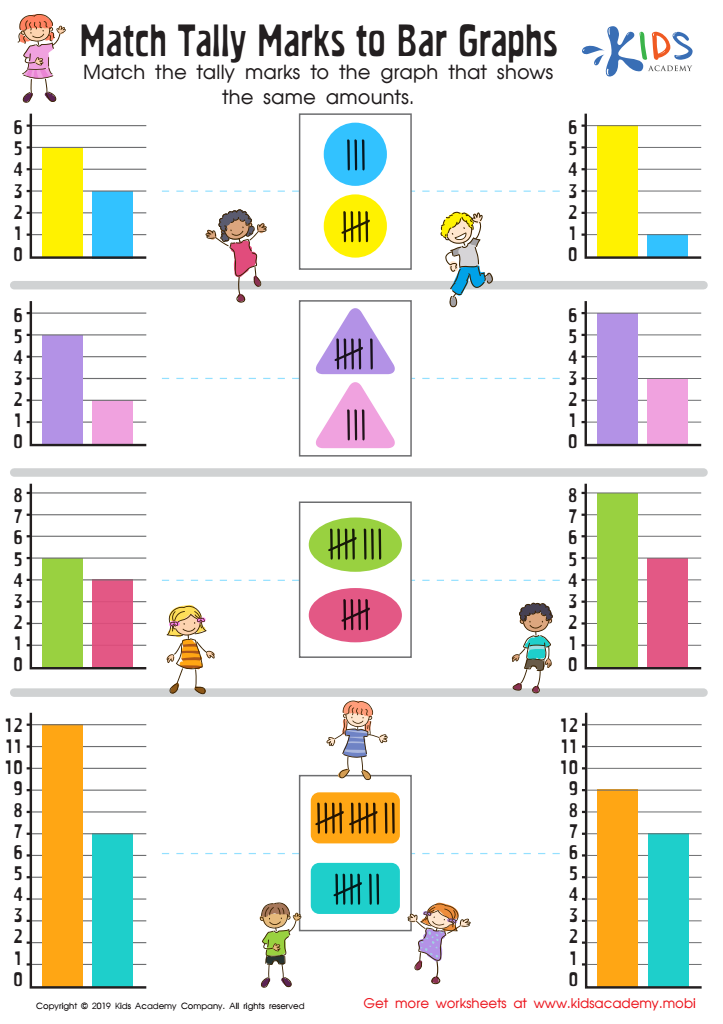

Match Tally Marks to Bar Graphs Worksheet
Understanding graphs and numbers is crucial for children aged 6-7 as it forms the foundation for their mathematical and analytical skills. At this stage in their development, children are increasingly exposed to various forms of data representation, such as pictographs and bar graphs, which help them visualize information easily. Teaching children to interpret these graphs fosters critical thinking and allows them to compare quantities, identify trends, and make decisions based on data.
Moreover, proficiency in numbers and graphs enhances problem-solving skills. By learning how to read graphs, children can begin to understand everyday situations—like analyzing their favorite sports teams' performance or evaluating survey results from classmates. This not only makes math engaging but also connects it to real-world scenarios.
Additionally, graph literacy lays the groundwork for more advanced concepts in math and science later in their educational journey. As technology and data become increasingly integral to daily life, equipping children with these skills early on ensures they are prepared for future academic endeavors. Ultimately, understanding graphs and numbers helps children become informed individuals capable of navigating a data-driven world, fostering confidence and facilitating better decision-making as they grow.
 Assign to My Students


