Unlock the world of data interpretation with our "Understanding Graphs Math Worksheets" designed specifically for children aged 7-8. These engaging worksheets introduce young learners to essential graph concepts, including bar graphs, line graphs, and pictographs, enhancing their ability to read and interpret visual information. Each worksheet features vibrant illustrations and real-life examples, making math fun and relatable. As your child practices creating and analyzing graphs, they'll develop critical thinking and analytical skills that are vital for their academic journey. Perfect for home or classroom use, these worksheets provide an interactive and educational experience that supports early math development. Get started today!

Check out this FREE Trial Lesson on Math for age 7-8!

Organize and Categorize Data #2

Favorites
With answer key
Interactive
  • 7-8
  • Understanding graphs
  • Math
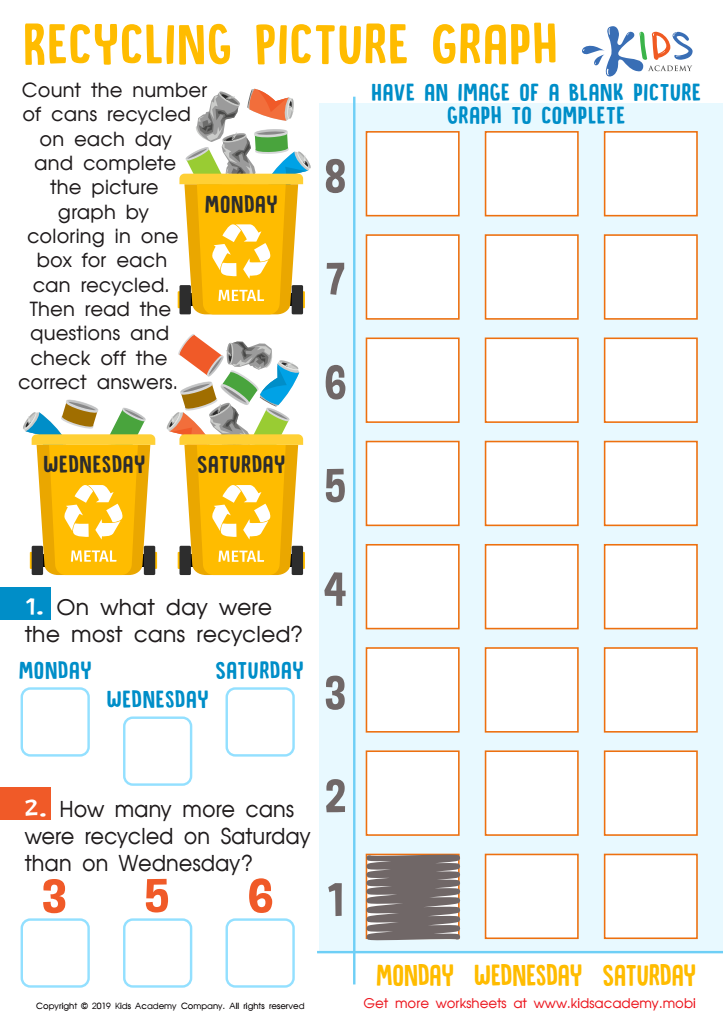
Recycling Picture Graph Worksheet

Recycling Picture Graph Worksheet

This worksheet can help kindergartners learn numbers and why recycling is important. After using items and materials, they can turn them into new materials instead of throwing them away. Guide your students to follow the instructions and answer the questions at the end. Help them understand how recycling benefits our environment.
Recycling Picture Graph Worksheet
Worksheet
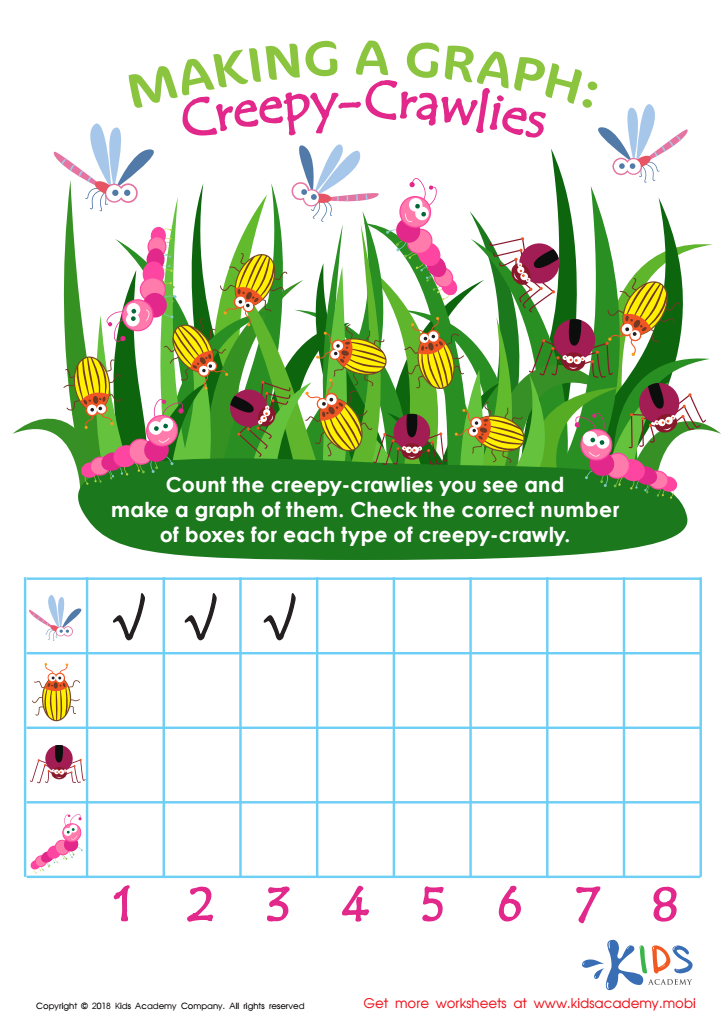
Making a Graph: Creepy Crawlies Worksheet

Making a Graph: Creepy Crawlies Worksheet

Let your little math whiz create a graph with this free PDF worksheet. They can count and sort the creepy-crawlies, checking off the correct number of boxes for each type. This engaging activity will help them hone their visual discrimination skills while efficiently organizing data.
Making a Graph: Creepy Crawlies Worksheet
Worksheet
Fruit Math: Picture Graphs Worksheet

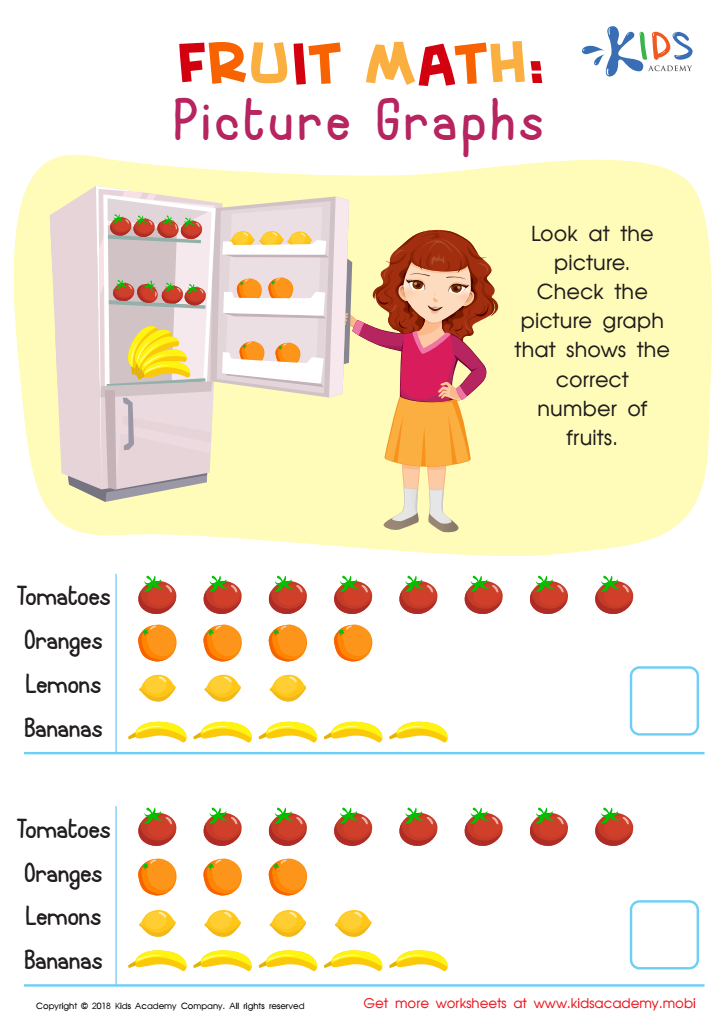
Fruit Math: Picture Graphs Worksheet

Help your child learn to draw graphs by having them look at pictures. Ask them to identify a graph that accurately portrays the data and have them explain why. This will prepare them to easily draw more complex graphs in the future. For example, have them look at the picture with the number of fruits in the colorful worksheet and explain why the graph is accurate.
Fruit Math: Picture Graphs Worksheet
Worksheet
Tricky Graphs Worksheet
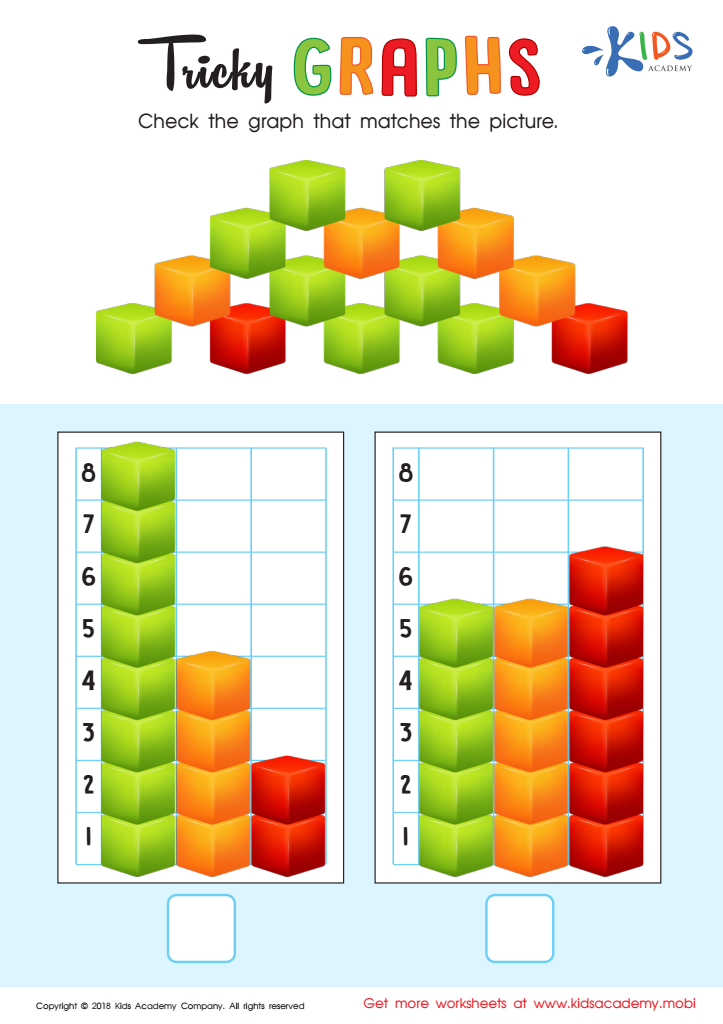
Tricky Graphs Worksheet

Looking for a fun way to sharpen your kid's graphing skills? Get this colorful PDF worksheet! They'll get to practice visual discrimination, counting, and creating bar graphs. Plus, graphing and reading graphs are essential for problem-solving in math.
Tricky Graphs Worksheet
Worksheet
Match Tally Marks to Bar Graphs Worksheet

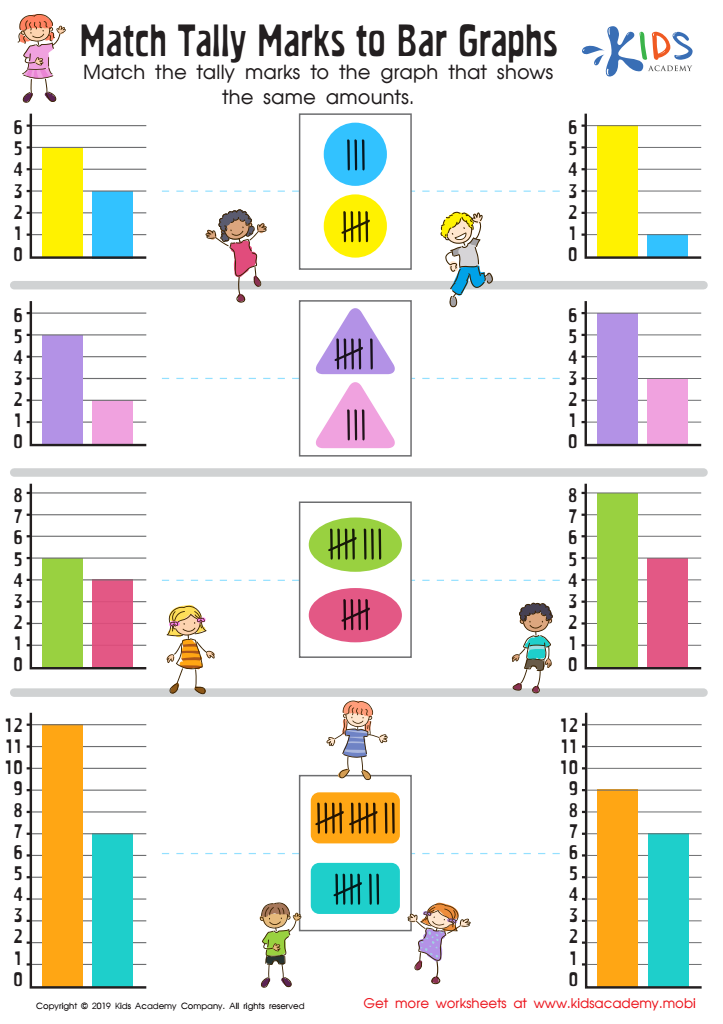
Match Tally Marks to Bar Graphs Worksheet

Learning math can be tough for kids. Rules and formulas can be confusing. Don't worry, this worksheet can help them understand graphs better. Show them how to match the tally marks with the graph that shows the same amount. It will help them grasp the basics and prepare them for more complex equations.
Match Tally Marks to Bar Graphs Worksheet
Worksheet
Aircraft Carrier Picture Graphs Worksheet

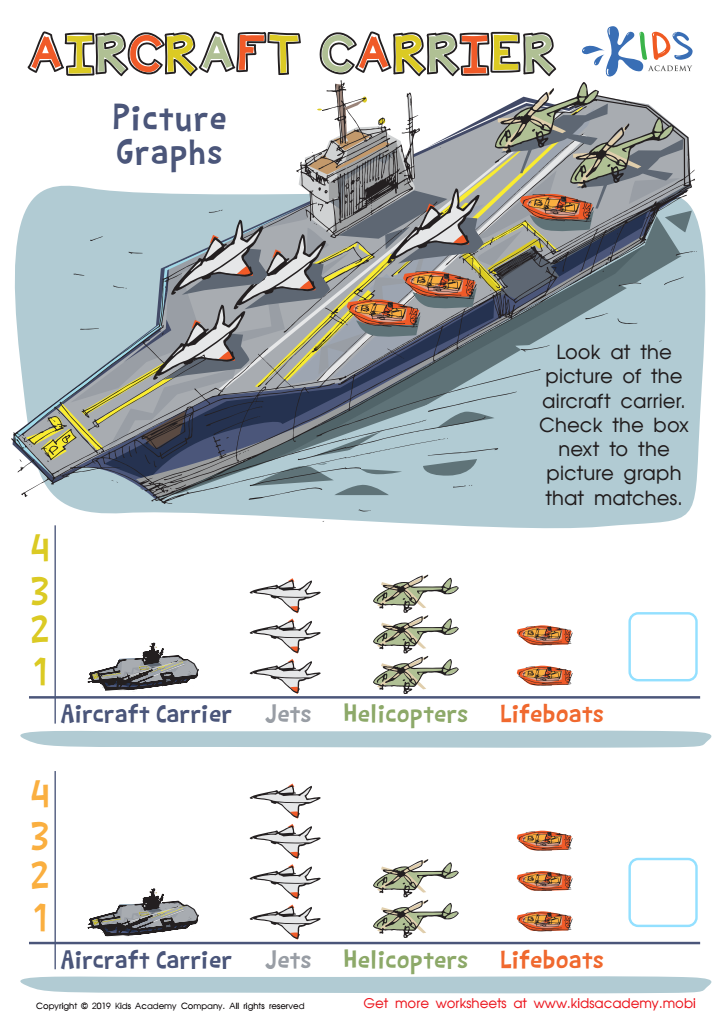
Aircraft Carrier Picture Graphs Worksheet

Kids love learning about jets and boats with this awesome worksheet! It's a great way to engage them as they work on picture graphs. Representing numerical values with pictures, this free PDF requires them to choose which picture graph and representation best match the carrier in the picture. It's also great practice for visual discrimination!
Aircraft Carrier Picture Graphs Worksheet
Worksheet


Understanding graphs is a crucial skill for children aged 7-8, and it’s imperative for parents and teachers to prioritize this learning. Graphs serve as visual representations of data, enabling children to comprehend information more effectively. This foundational skill supports critical thinking and analytical abilities, which are essential throughout their educational journey and in everyday life.

At this age, children begin to encounter various forms of data, from simple pictographs to bar graphs, and learning to interpret these can help them grasp concepts of comparison, quantity, and trends. By understanding graphs, children develop the ability to analyze information, recognize patterns, and make informed decisions based on visual data.

Moreover, graph literacy fosters communication skills as kids learn to articulate findings or insights derived from these visual tools. This understanding can enrich their experience in science, social studies, and even art, where data representation is often necessary. Additionally, the skills learned through graph comprehension pave the way for more complex mathematical concepts in the future, ensuring students are well-prepared for advanced studies. Thus, encouraging this skill set benefits not only academic performance but also supports lifelong learning and informed citizenship.