Understanding graphs Numbers Worksheets for Ages 7-9
3 filtered results
-
From - To
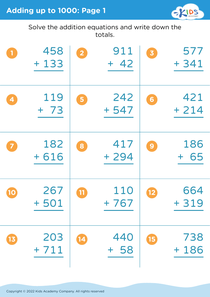
Unlock your child's potential with our "Understanding Graphs Numbers Worksheets for Ages 7-9." These engaging worksheets are designed to make learning graphs fun and effective. By exploring colorful charts and diagrams, children develop essential skills in reading, interpreting, and creating graphs. Our worksheets cover various topics, including bar graphs, pie charts, and line plots, ensuring a well-rounded introduction to data visualization. Designed to align with educational standards, these resources help your child excel in math while boosting their confidence. Interactive activities and real-world examples make graphing meaningful and exciting, laying a strong foundation for future academic success.

Making a Graph: Creepy Crawlies Worksheet

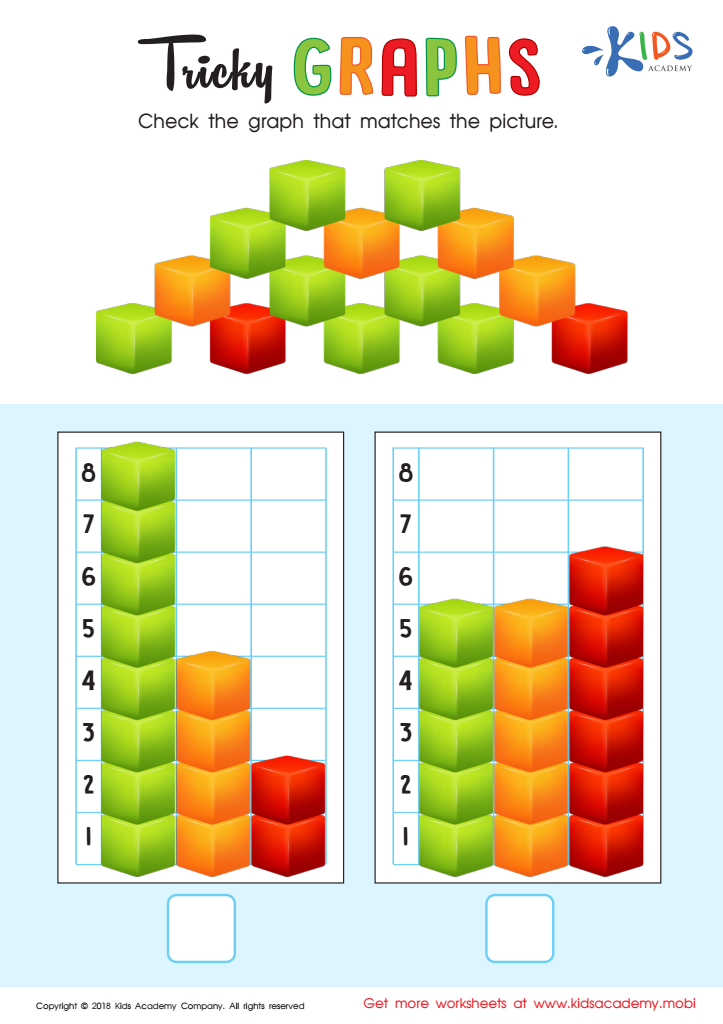
Tricky Graphs Worksheet

Match Tally Marks to Bar Graphs Worksheet


Parents or teachers should care about understanding graphs and numbers for children aged 7 to 9 because these skills form a vital foundation for their future academic success and everyday problem-solving abilities. Graphs and numbers, or quantitative literacy, are cornerstones of mathematics, which in turn underpins many subjects and real-world activities.
At this age, children are naturally curious and capable of grasping basic concepts of data representation and numerical relationships. By learning to interpret graphs, children develop critical thinking skills as they begin to see patterns, make predictions, and draw conclusions based on data. This visual representation of information makes it easier for children to understand and retain mathematical concepts, moving beyond rote memorization to true comprehension.
Additionally, numerical skills are crucial for everyday tasks such as handling money, telling time, and understanding measurements. A strong grasp of numbers also builds a foundation for more complex subjects like science and technology.
Lastly, fostering confidence in dealing with graphs and numbers at an early age can reduce math anxiety, encouraging a positive attitude towards learning. As children navigate their academic journey, these foundational skills will equip them with the tools needed to adapt, excel, and succeed in an increasingly data-driven world.