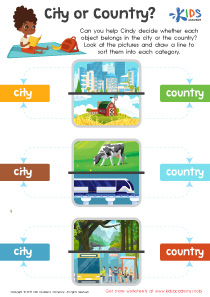
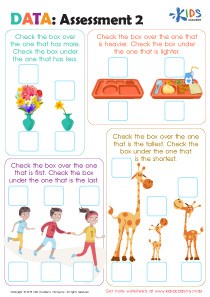
Understanding line plots Math Worksheets for Ages 8-9
10 filtered results
-
From - To
Explore our engaging "Understanding Line Plots" math worksheets designed for children ages 8-9. These resources aim to build foundational skills in interpreting and creating line plots, an essential concept in data representation and analysis. Each worksheet offers a variety of exercises that encourage students to analyze, compare, and understand data sets shown in line plots. With clear instructions and visually appealing designs, these worksheets ensure that learning is both effective and enjoyable. Whether in the classroom or at home, our worksheets are perfect for enhancing math proficiency and fostering a love for learning in young students. Start your line plot journey today!
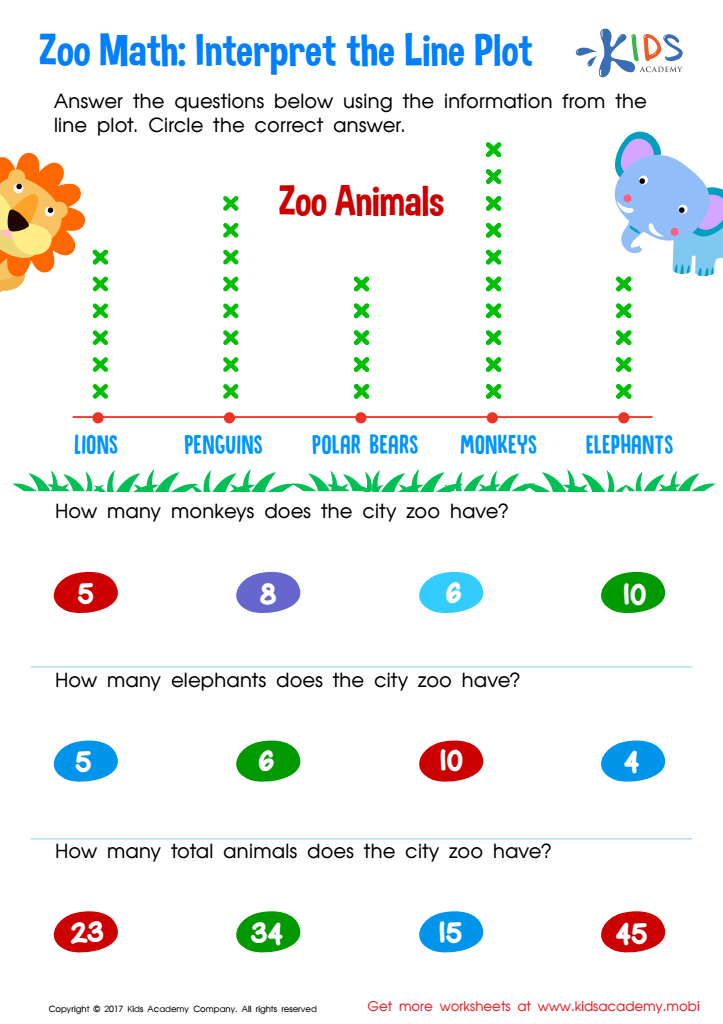

Interpret Line Plot Worksheet


What Is a Line Plot? Worksheet
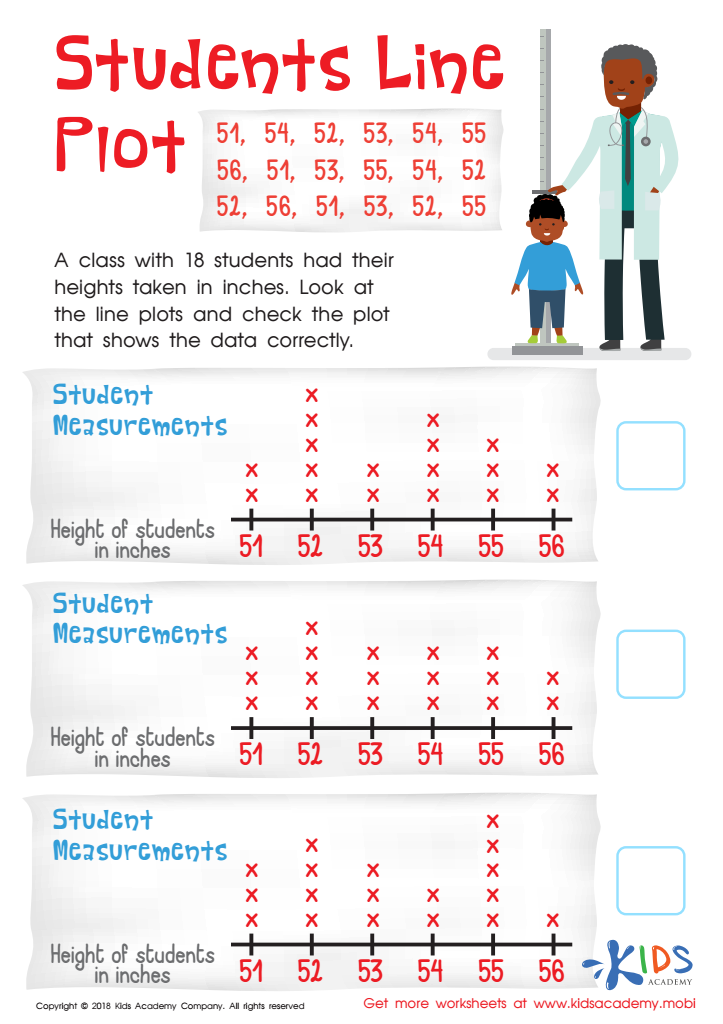

Students Line Plot Worksheet
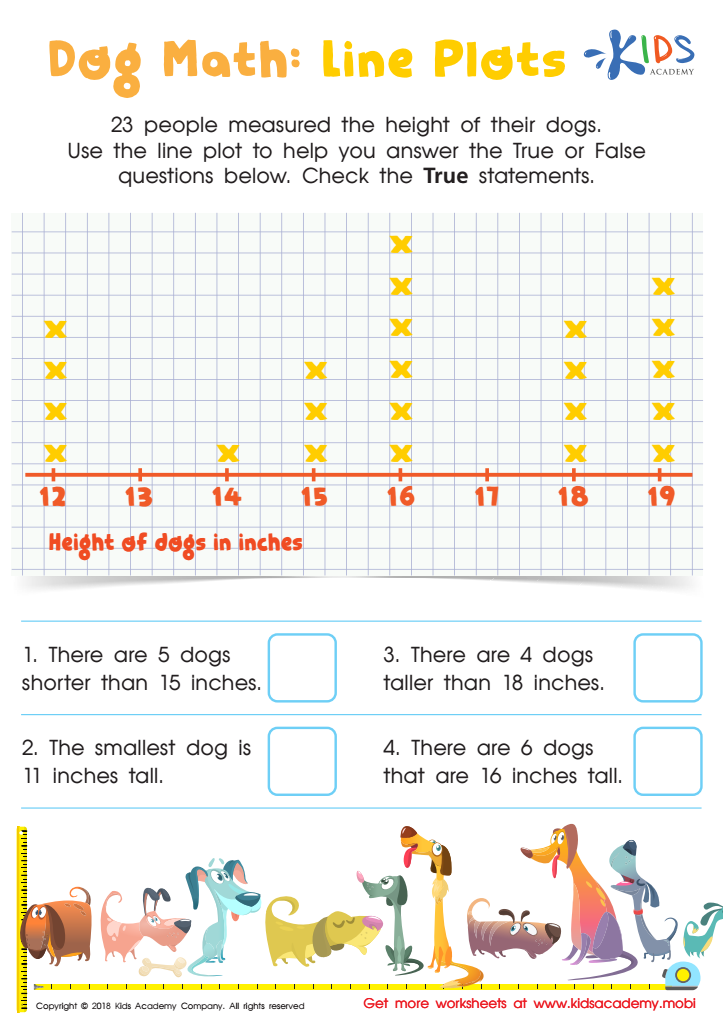

Dog Math: Line Plots Worksheet
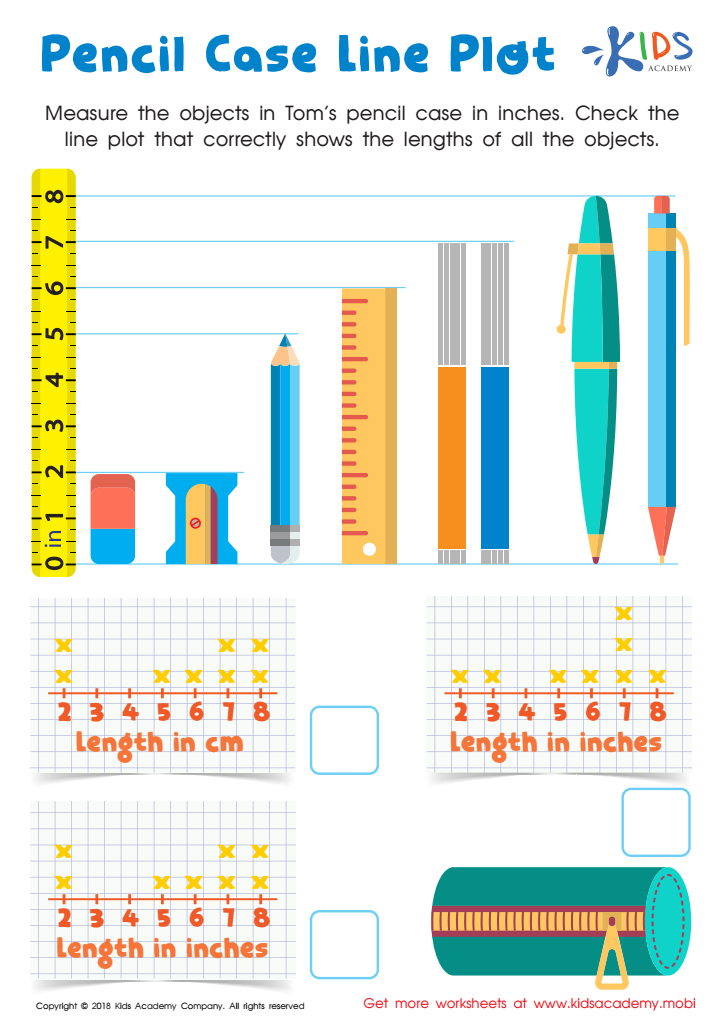

Pencil Case Line Plot Worksheet
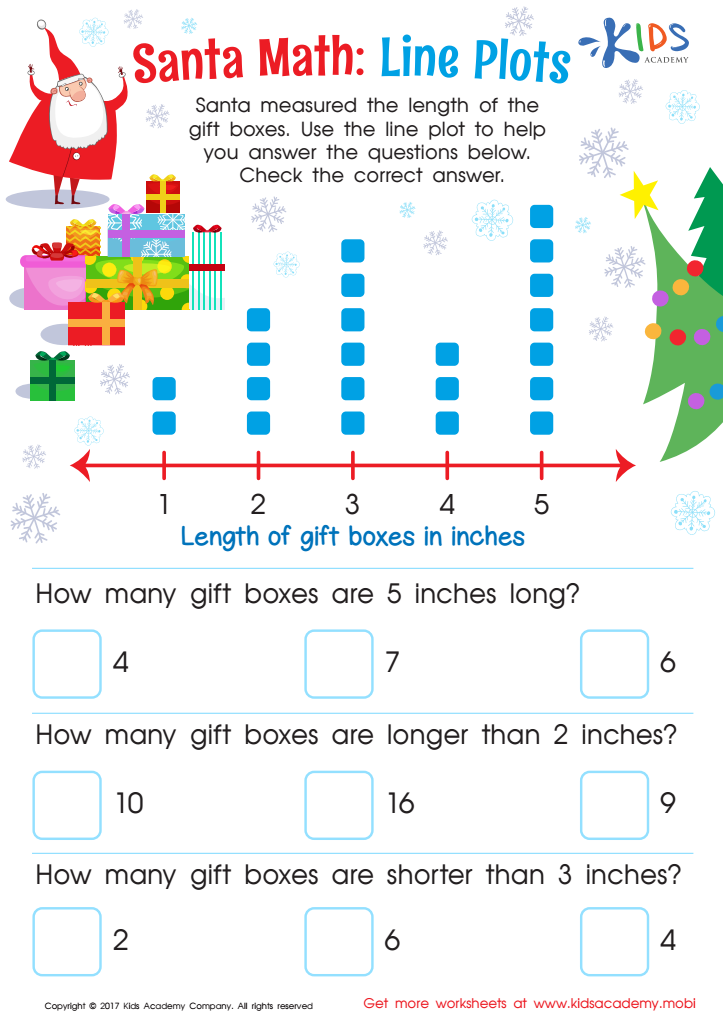

Line Plot Worksheet
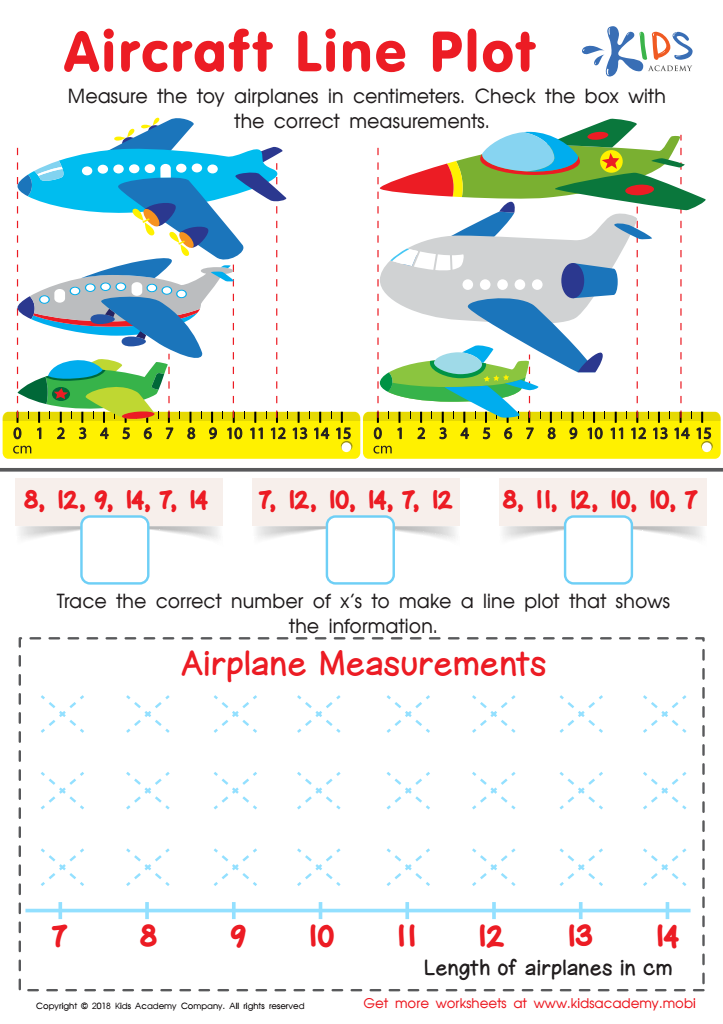

Aircraft Line Plot Worksheet
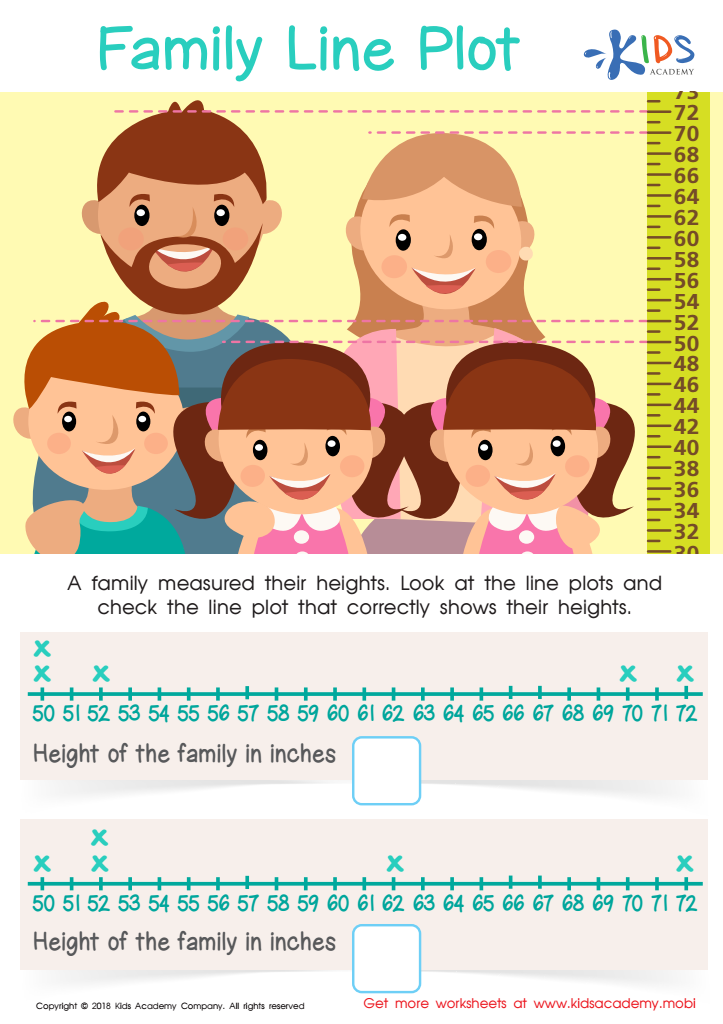

Family Line Plot Worksheet
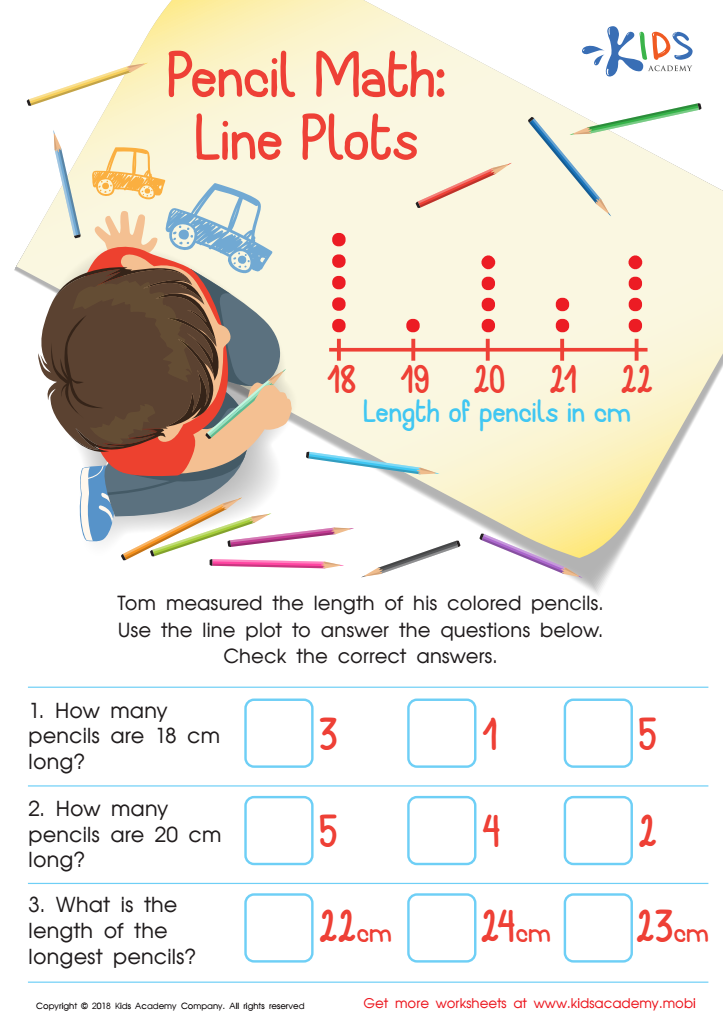

Pencil Math: Line Plots Worksheet
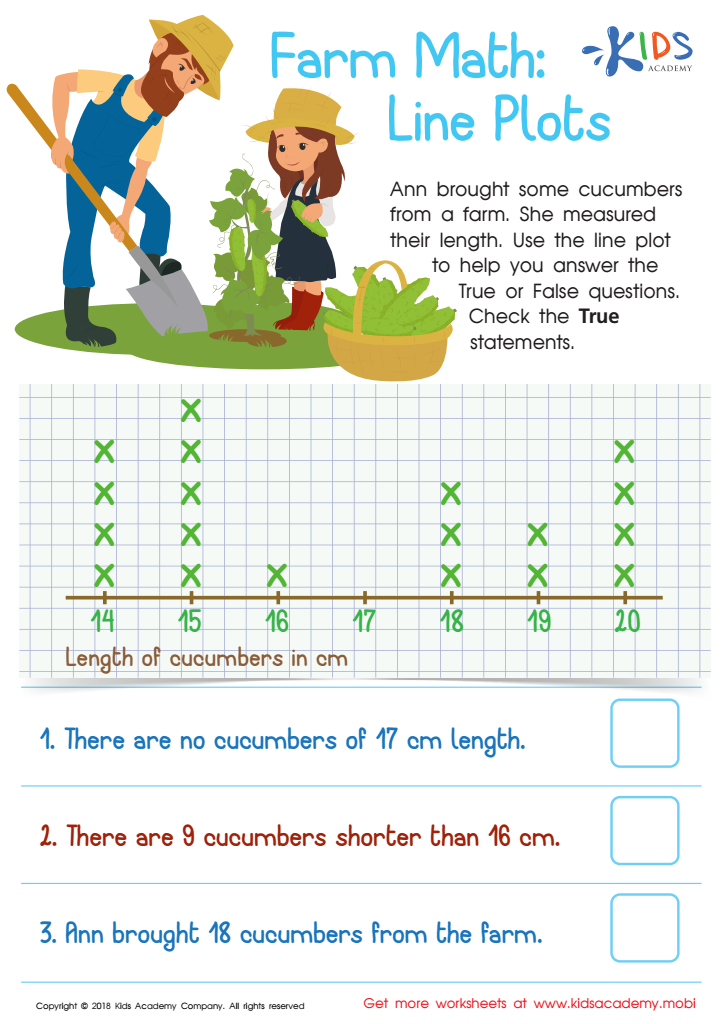

Farm Math: Line Plots Worksheet
Understanding line plots is essential for children aged 8-9 as it lays a foundational skill in mathematical literacy. Line plots help students visualize data points on a number line, making it easier to interpret and analyze information. For parents and teachers, fostering this understanding promotes critical thinking and enhances problem-solving capabilities.
In a world increasingly driven by data, grasping graphical representations like line plots is key to interpreting information effectively. Mastery of this concept can improve students' ability to handle real-life situations, such as recording survey results or tracking daily temperatures, fostering connections between math and everyday experiences.
Moreover, line plots cultivate skills in comparison and data organization, teaching children how to identify trends or patterns in data sets. It serves as adaptable knowledge that supports future learning in more complex statistical concepts.
By emphasizing line plots, parents and teachers encourage a trend of curiosity and analytical thinking. When students feel confident in working with visual data representation, it bolsters their self-esteem and promotes a positive attitude towards math. Therefore, understanding line plots is not just a requirement but a vital step in a child's educational journey.
 Assign to My Students


