Data interpretation Math Worksheets for Ages 6-8
19 filtered results
Difficulty Level
Grade
Age
-
From - To
Subject
Activity
Standards
Favorites
With answer key
Interactive
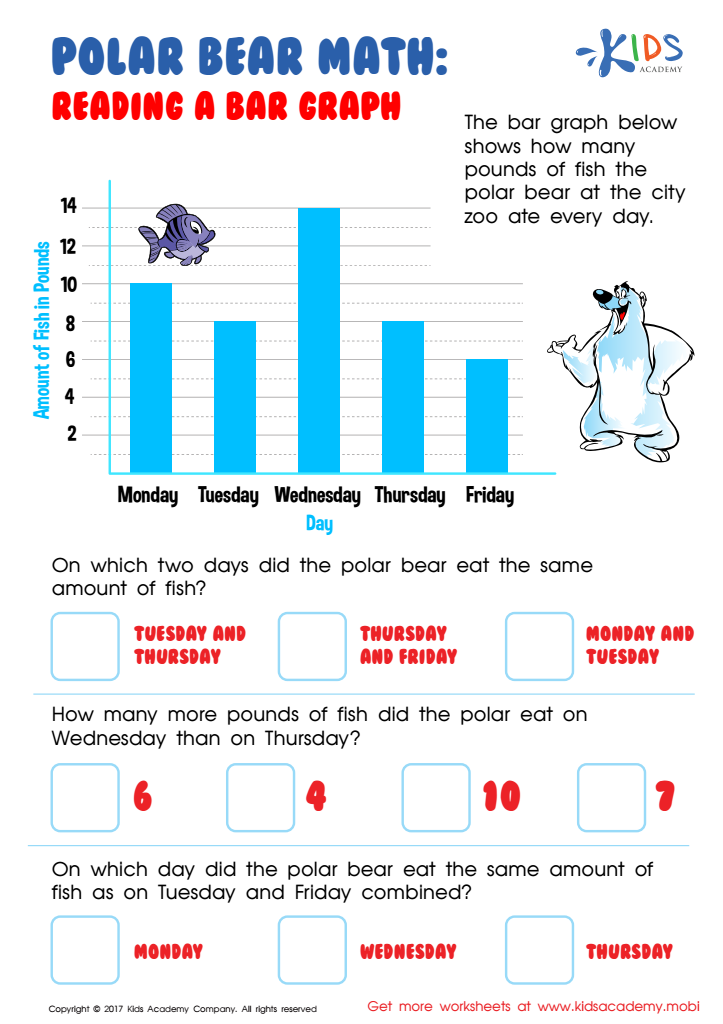

Reading Bar Graph Worksheet
Take your child north to practice data reading with a polar bear friend! This worksheet challenges 3rd graders to interpret data on a graph and solve related math problems.
Reading Bar Graph Worksheet
Worksheet
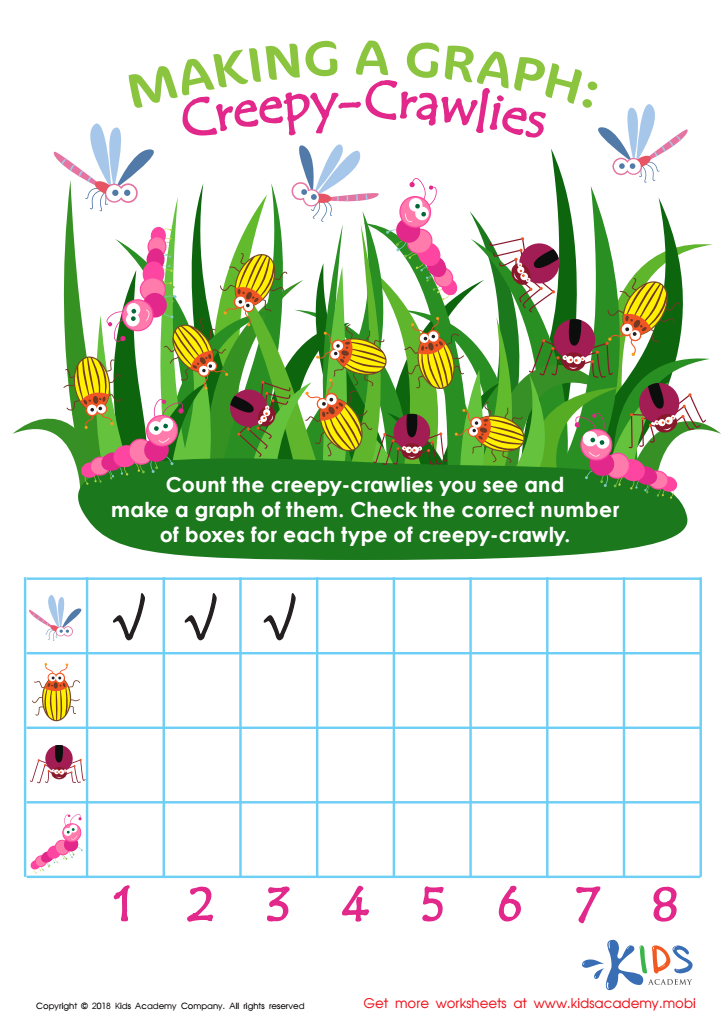

Making a Graph: Creepy Crawlies Worksheet
Let your little math whiz create a graph with this free PDF worksheet. They can count and sort the creepy-crawlies, checking off the correct number of boxes for each type. This engaging activity will help them hone their visual discrimination skills while efficiently organizing data.
Making a Graph: Creepy Crawlies Worksheet
Worksheet
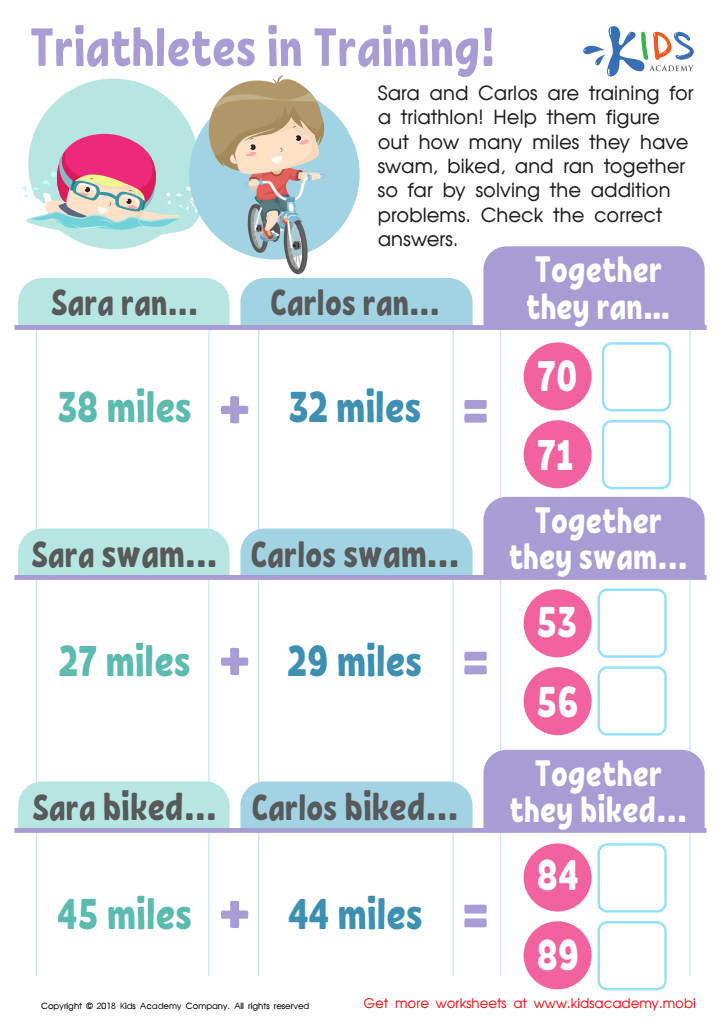

Triathletes in Training Worksheet
Sara and Carlos are training for a triathlon and need your child's help! They must solve the addition problems to figure out how many miles they've swam, ran, and biked. Help your kid check the answers and get them ready for the triathlon!
Triathletes in Training Worksheet
Worksheet
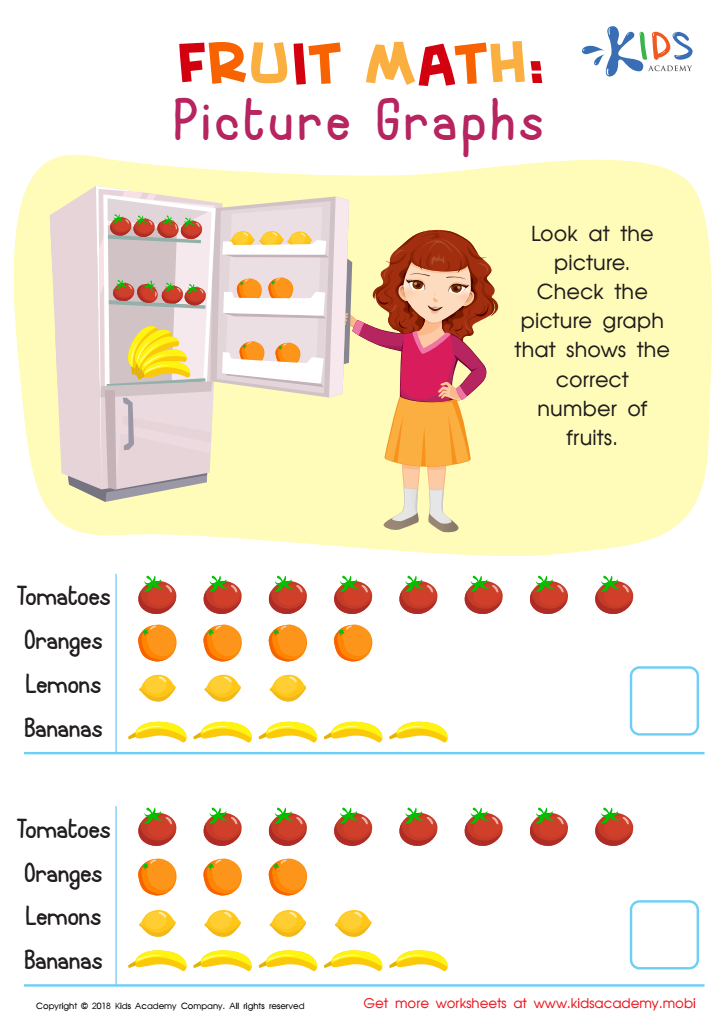

Fruit Math: Picture Graphs Worksheet
Help your child learn to draw graphs by having them look at pictures. Ask them to identify a graph that accurately portrays the data and have them explain why. This will prepare them to easily draw more complex graphs in the future. For example, have them look at the picture with the number of fruits in the colorful worksheet and explain why the graph is accurate.
Fruit Math: Picture Graphs Worksheet
Worksheet
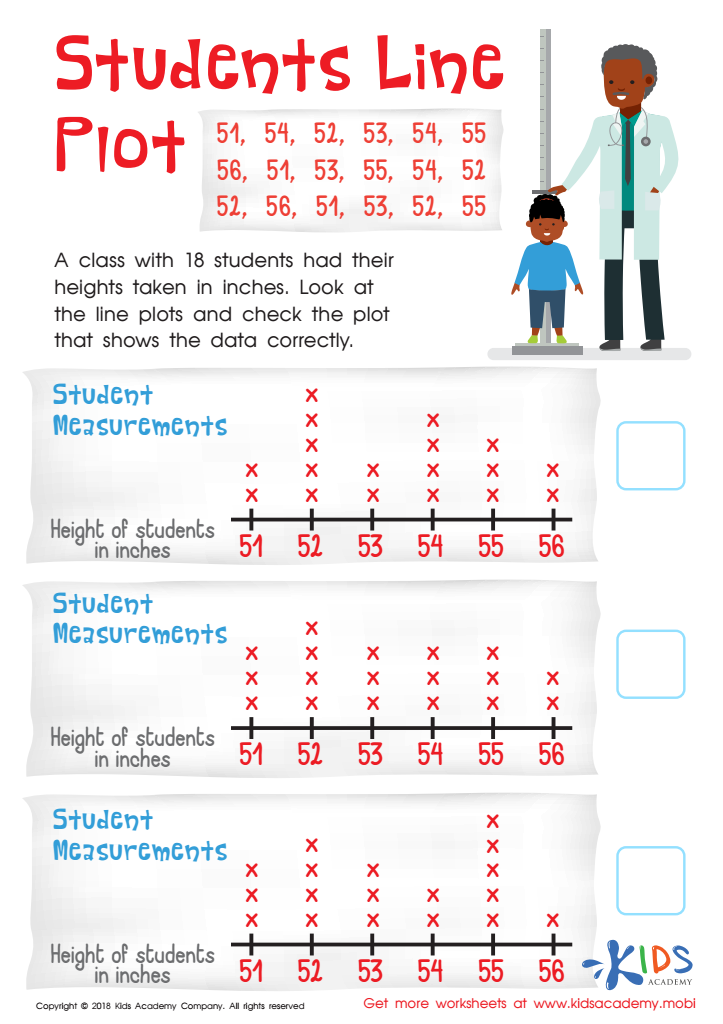

Students Line Plot Worksheet
Help your students learn to draw a line plot correctly by giving real examples. In this exercise, they must check the data of a class of 18 students' heights (in inches). Have them compare two line plots and figure out which one is correct.
Students Line Plot Worksheet
Worksheet
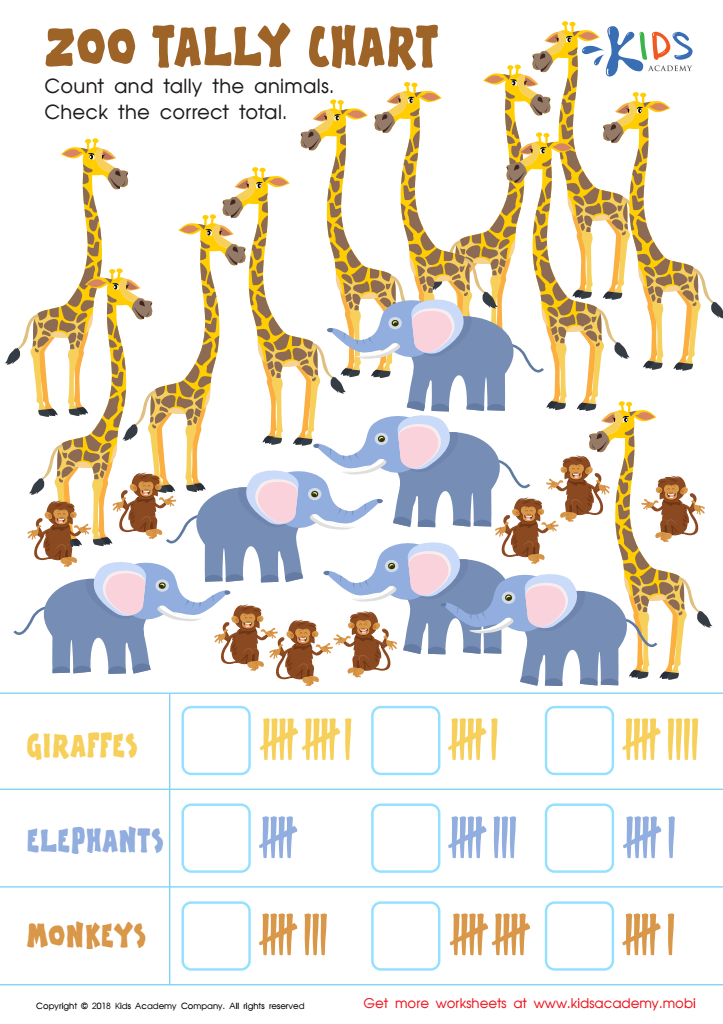

Zoo Tally Chart Worksheet
Your young mathematician will have fun counting and tallying zoo animals on this worksheet! Giraffes, elephants and monkeys - all accurately tallied at the bottom. They will assign values to each animal group to find the answer. It's math but they won't know it - it's a zoo out there!
Zoo Tally Chart Worksheet
Worksheet
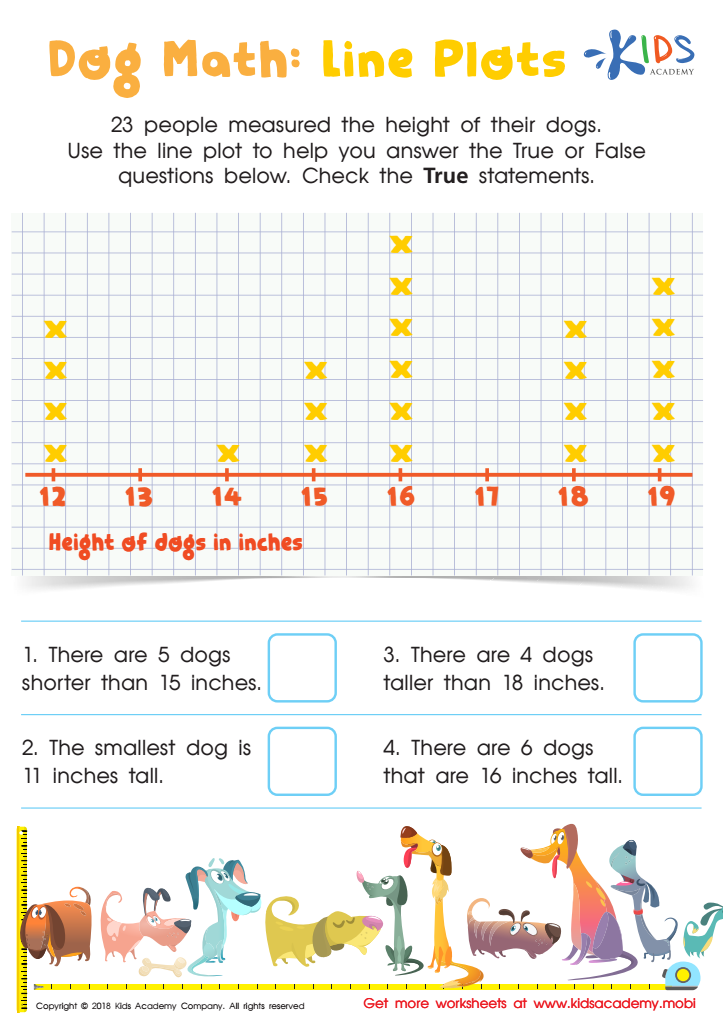

Dog Math: Line Plots Worksheet
Do your kids love dogs? If you have family pets, your kids may be excited to do this worksheet. It involves a line plot and True/False questions about 23 people measuring their dogs' heights. Assist your kids in verifying the statements that are True.
Dog Math: Line Plots Worksheet
Worksheet
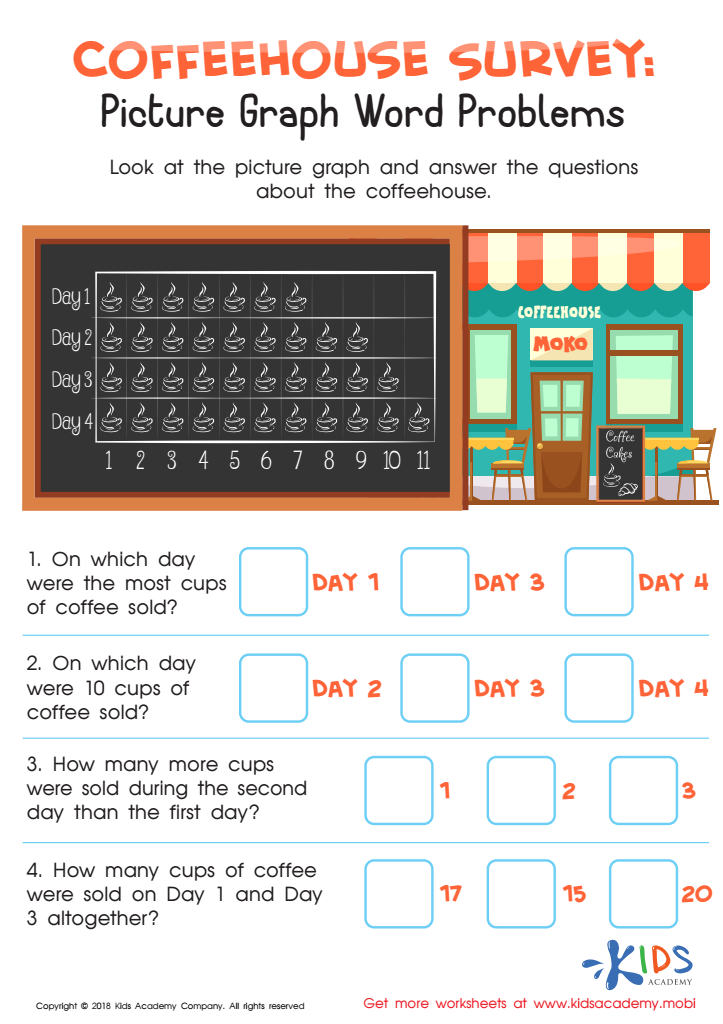

Coffeehouse Survey: Picture Graph Word Problems Worksheet
This coffeehouse survey helps children interpret pictures and answer questions. Your child will look at a picture graph displaying daily coffee cup sales from Day 1 to Day 4. Aid them in answering questions on the number of cups sold and which day had the most sales.
Coffeehouse Survey: Picture Graph Word Problems Worksheet
Worksheet
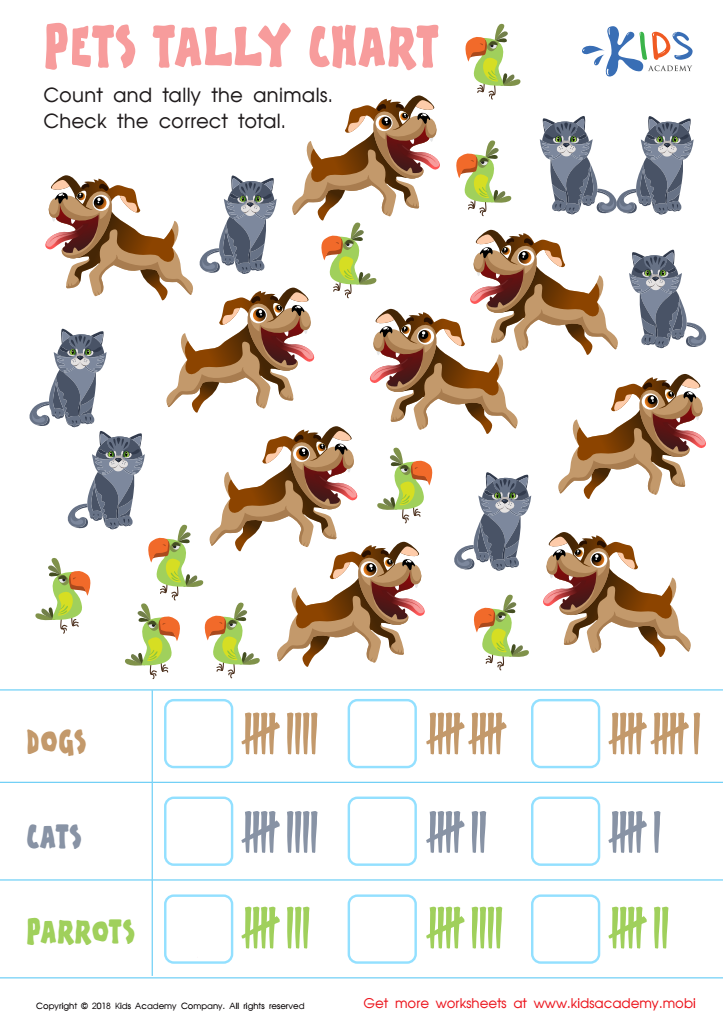

Pets Tally Chart Worksheet
Let your little mathematician count and tally the animals with this fun PDF worksheet. They'll assign value to each pet type and select the correct answer. It's a great way to practice number reasoning and learn how tallying helps keep math organized and efficient when solving equations.
Pets Tally Chart Worksheet
Worksheet
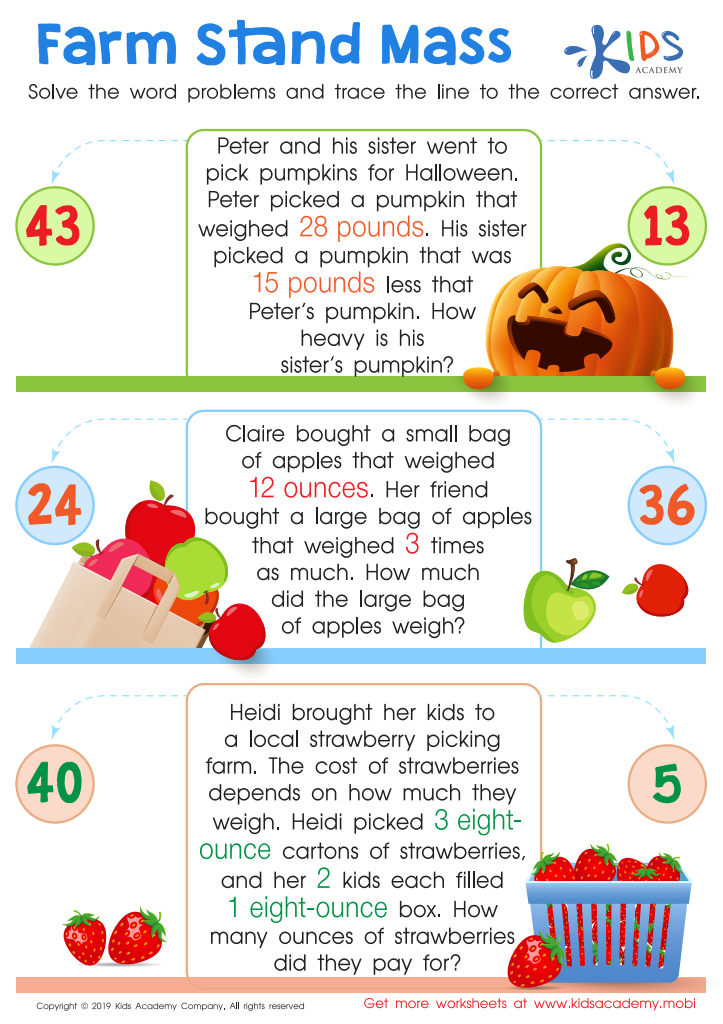

Farm Stand Mass Worksheet
Engage your kids in a fun learning adventure! Encourage them to practice what they learn in school using this worksheet. Look at the picture and read the problem together. Help them solve it and trace the line to the answer. Make learning enjoyable and your kids will be more motivated!
Farm Stand Mass Worksheet
Worksheet
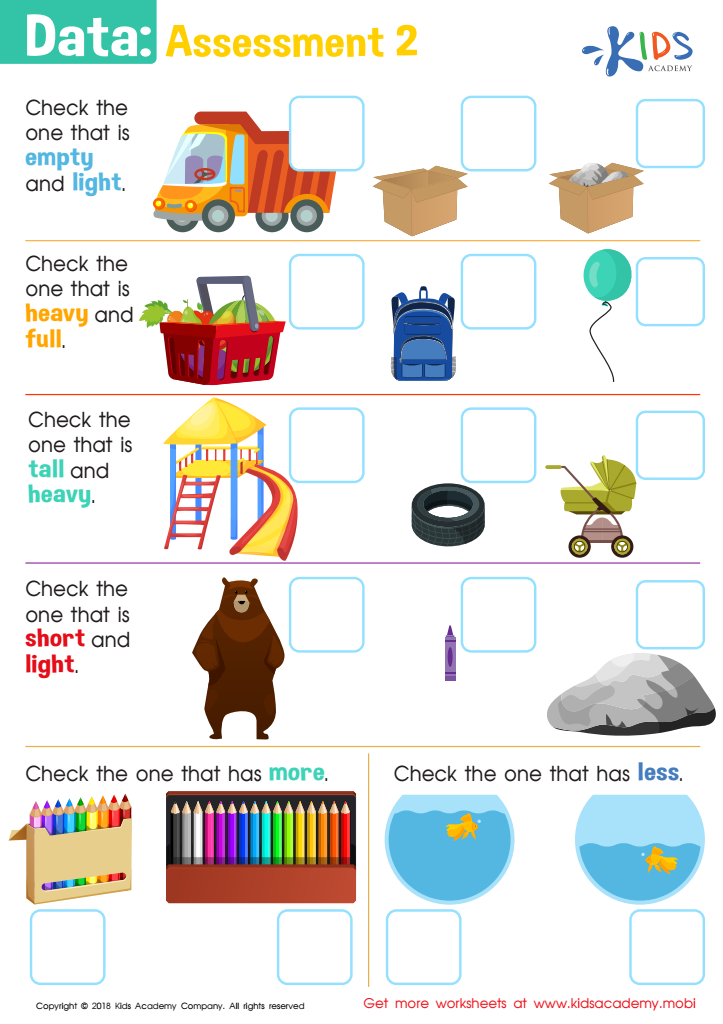

Data: Assessment 2 Worksheet
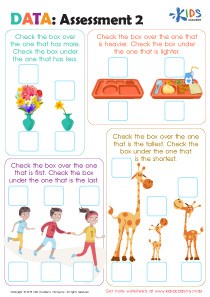
This PDF helps you assess your students' understanding of concepts like empty/light, full/heavy, tall/short, and more/less. With this worksheet, students use pictures to answer questions and check off the appropriate box. It's a fast, easy way to determine what concepts they have learned and which need more work.
Data: Assessment 2 Worksheet
Worksheet
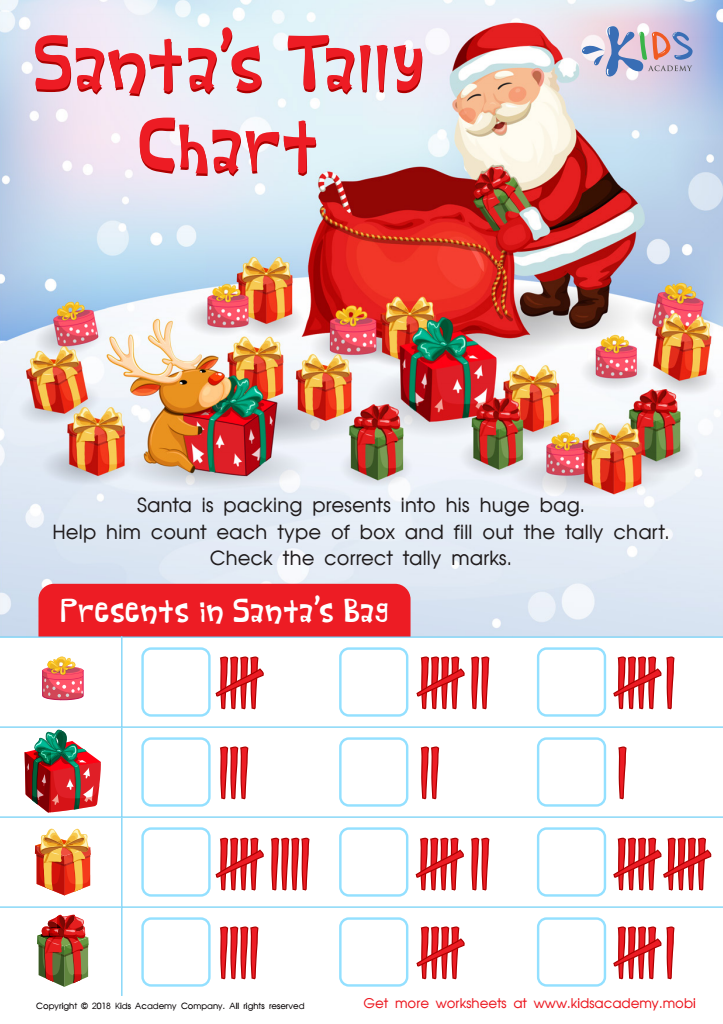

Santa Tally Chart Worksheet
Santa's got a big bag of gifts to count! Kids can help with this fun PDF worksheet, practicing visual recognition and representation skills while they sort and tally the presents. They'll also work on charting as they fill in the tally chart and send Santa off for a happy holiday. Ho, Ho, Ho!
Santa Tally Chart Worksheet
Worksheet
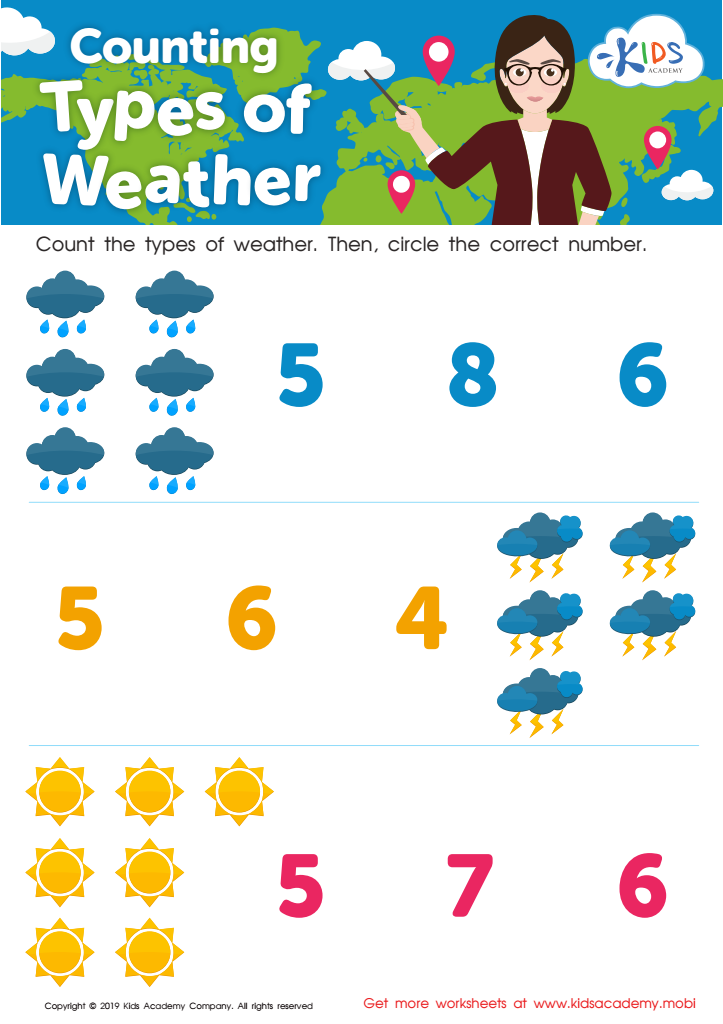

Counting Types of Weather Worksheet
Have your students look outside and tell you the weather today. Get kindergartners thinking by asking them to name different types of weather. Point to each one in the picture and get them to tell you what it is. Then, have them count the types and circle the number.
Counting Types of Weather Worksheet
Worksheet
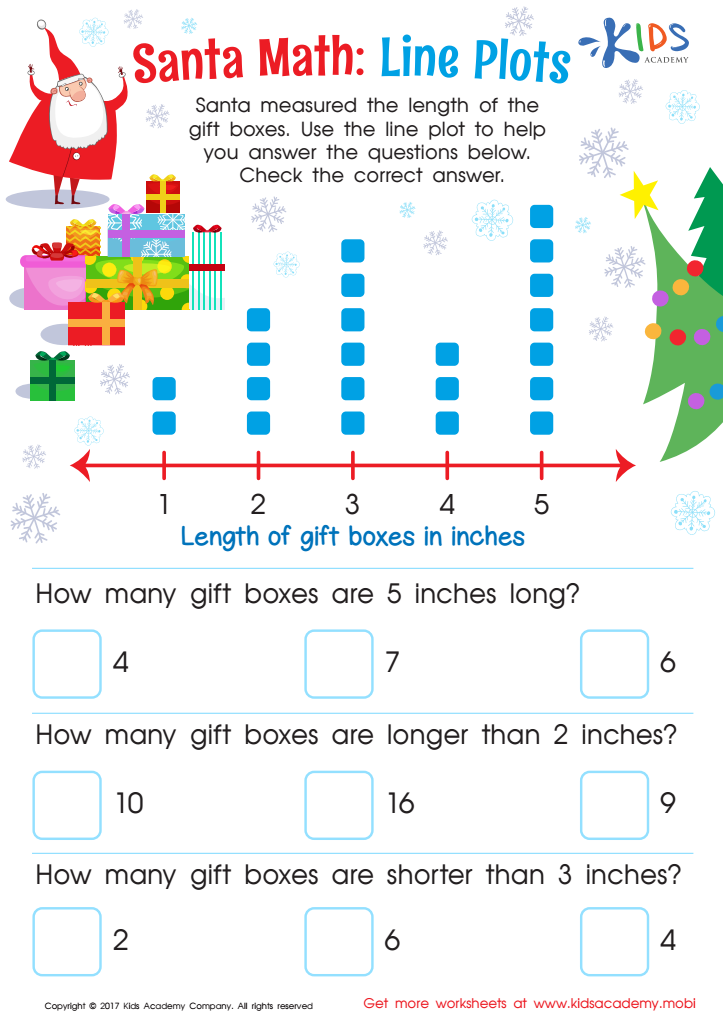

Line Plot Worksheet
Help your child measure presents with Santa using this 2nd grade line plot worksheet! It's a fun way to boost math skills and analyze data. Plus, it's sure to delight your child!
Line Plot Worksheet
Worksheet
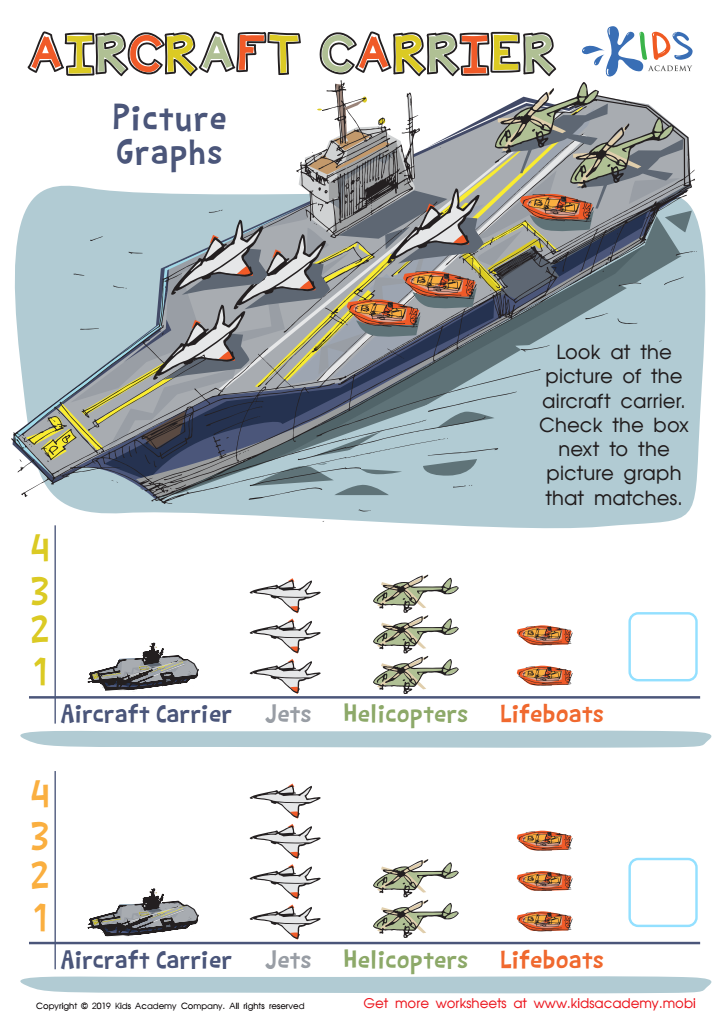

Aircraft Carrier Picture Graphs Worksheet
Kids love learning about jets and boats with this awesome worksheet! It's a great way to engage them as they work on picture graphs. Representing numerical values with pictures, this free PDF requires them to choose which picture graph and representation best match the carrier in the picture. It's also great practice for visual discrimination!
Aircraft Carrier Picture Graphs Worksheet
Worksheet
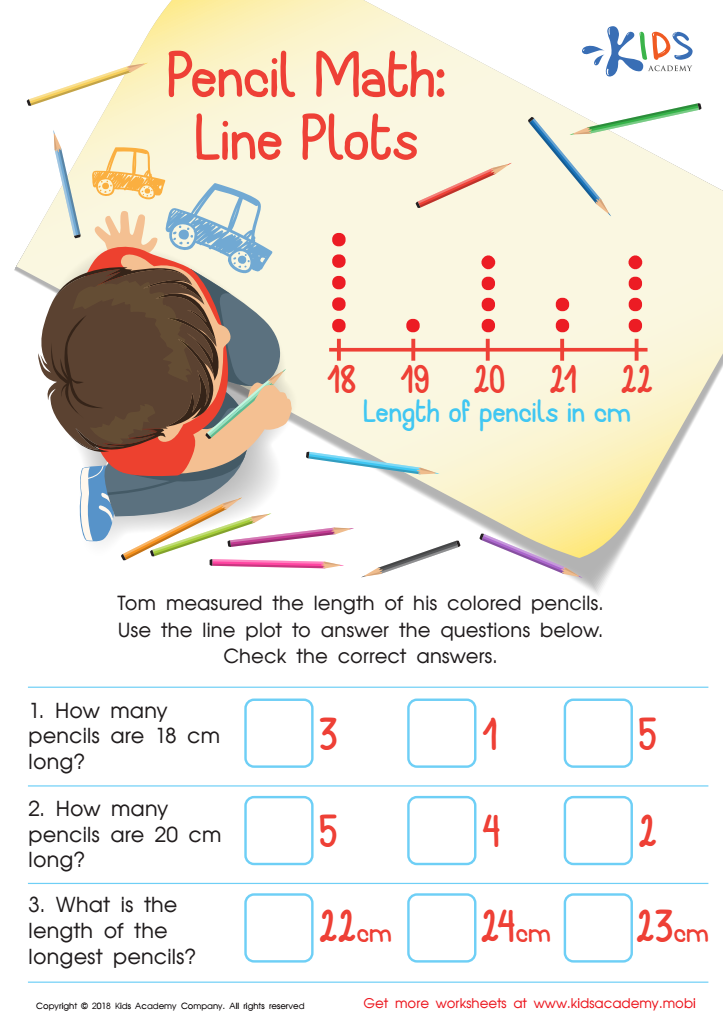

Pencil Math: Line Plots Worksheet
Your child will meet Tom in this worksheet, helping him find the length of his colored pencils. Tom has written the lengths in cm, and the line plot will help your kids answer the questions. Check the correct answers for each, including how many pencils are of a certain length. The line plot makes it easy to find the answers.
Pencil Math: Line Plots Worksheet
Worksheet
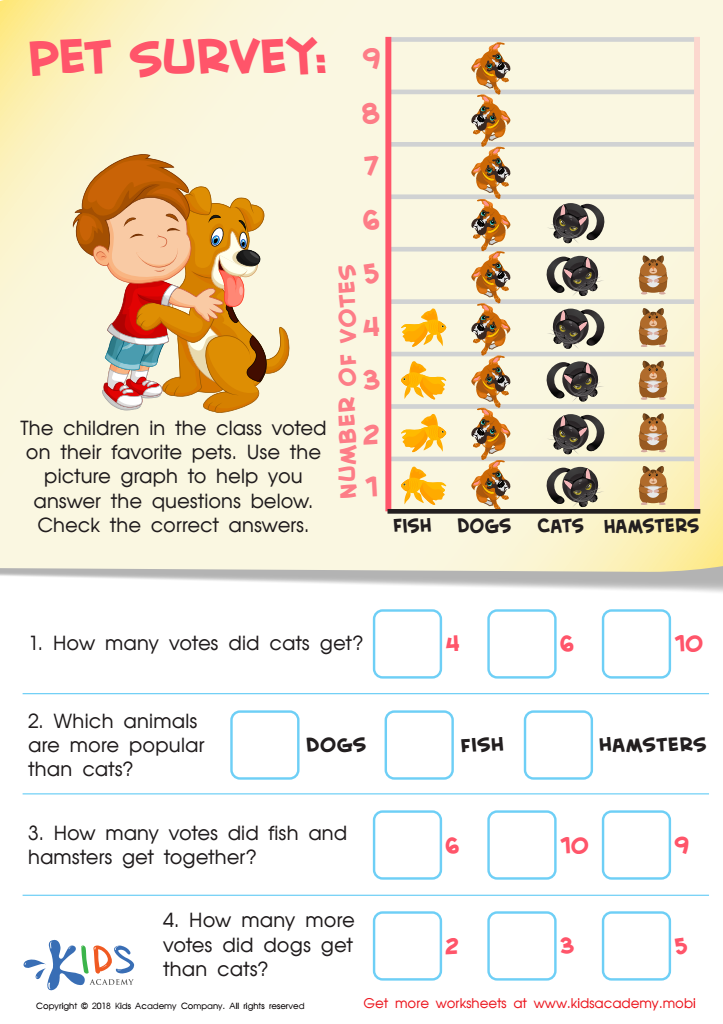

Pet Survey Worksheet
Do you have a furry family member? If the answer is yes and your kids love animals, they'll enjoy this worksheet. The picture graph shows the children's votes for their favorite pet - fish, dog, cat and hamster. Ask your child to use the graph to answer the questions. Guide them to check the right answer.
Pet Survey Worksheet
Worksheet
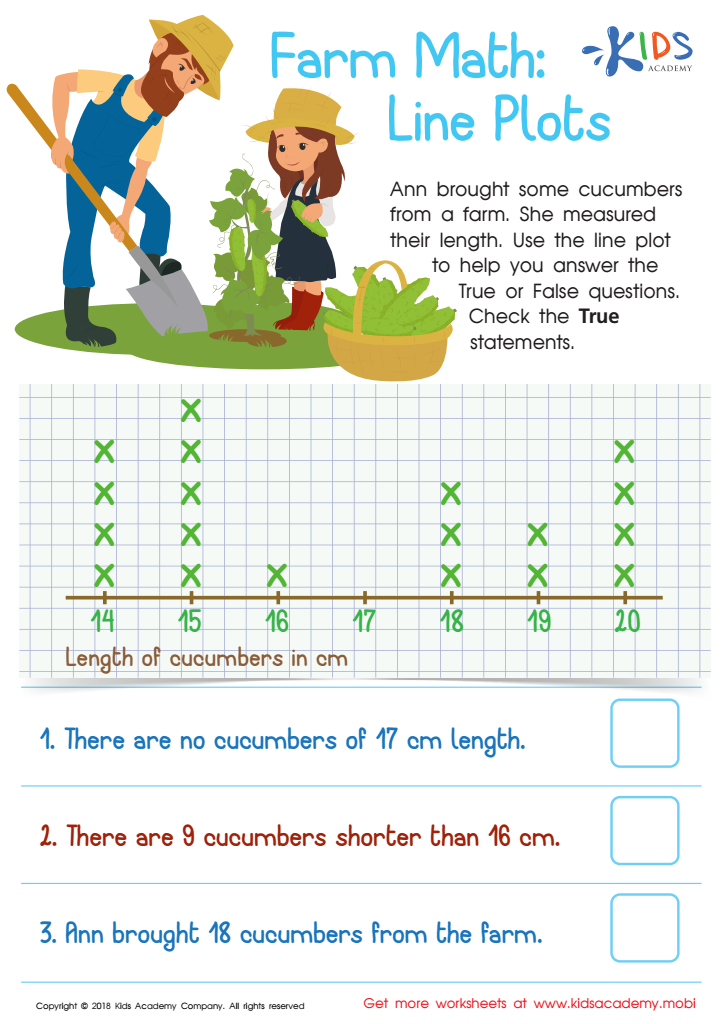

Farm Math: Line Plots Worksheet
Ann brought cucumbers from a farm and measured their length. She drew a line plot for your students to use to answer True/False questions about the number and length of the cucumbers. Ask your students to check only the True statements. (80 words)
Farm Math: Line Plots Worksheet
Worksheet
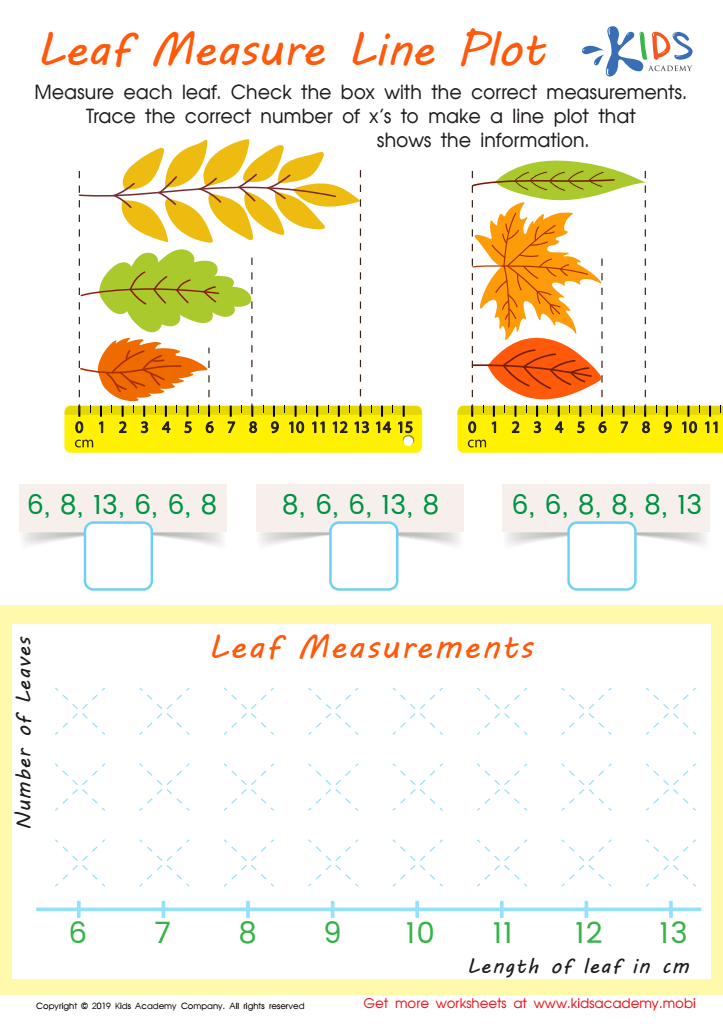

Leaf Measure Line Plot Worksheet
Help your third grader measure each of the four leaves, and check the box with the correct measurements. Then, trace the right number of x's to make a line plot showing the data. This exercise will engage your students and make it easier for them to grasp the concept of line plots.
Leaf Measure Line Plot Worksheet
Worksheet
 Assign to My Students

.jpg)

.jpg)

.jpg)
