Critical Thinking Measurement Worksheets for Ages 8-9
3 filtered results
Difficulty Level
Grade
Age
-
From - To
Subject
Activity
Standards
Popularity
Favorites
With answer key
Interactive

Reading Bar Graph Worksheet
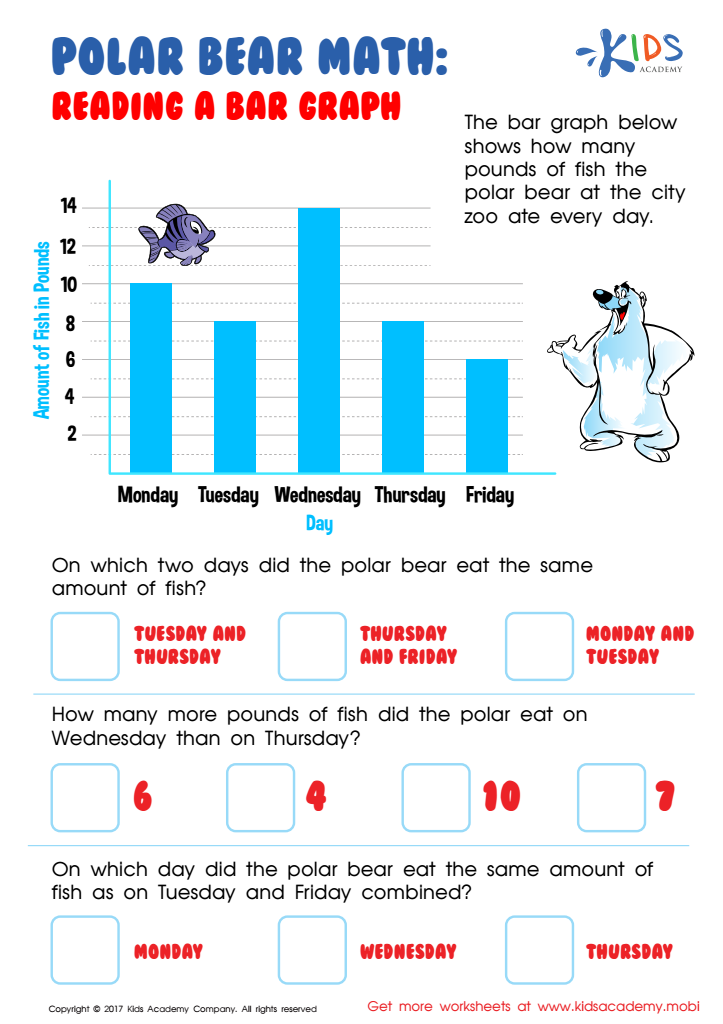
Take your child north to practice data reading with a polar bear friend! This worksheet challenges 3rd graders to interpret data on a graph and solve related math problems.
Reading Bar Graph Worksheet
Worksheet
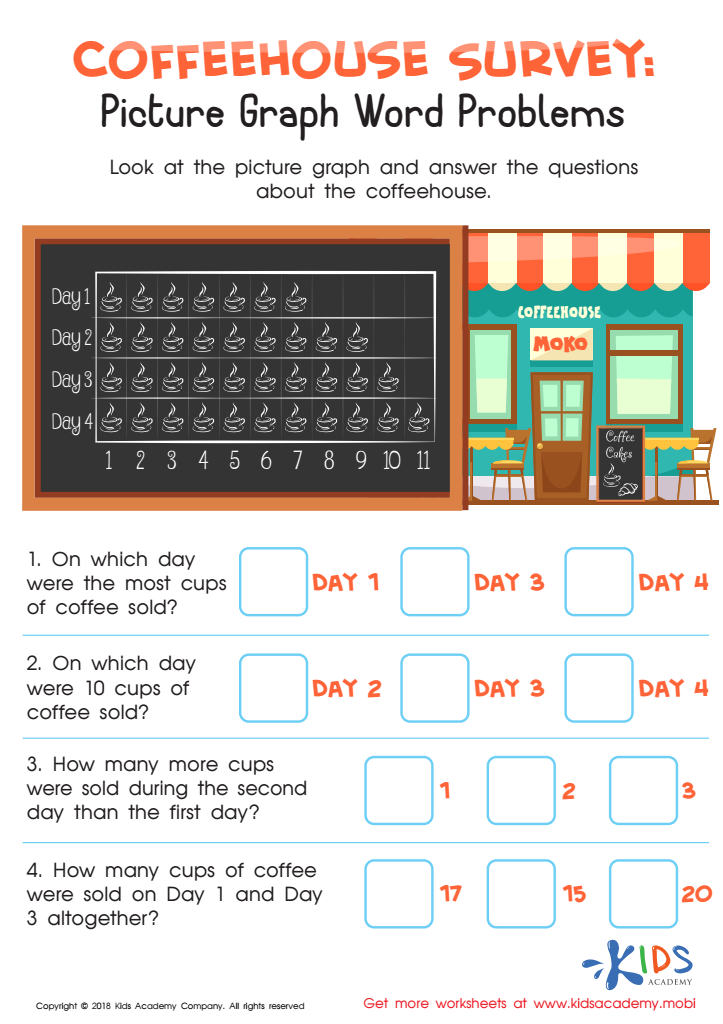

Coffeehouse Survey: Picture Graph Word Problems Worksheet
This coffeehouse survey helps children interpret pictures and answer questions. Your child will look at a picture graph displaying daily coffee cup sales from Day 1 to Day 4. Aid them in answering questions on the number of cups sold and which day had the most sales.
Coffeehouse Survey: Picture Graph Word Problems Worksheet
Worksheet
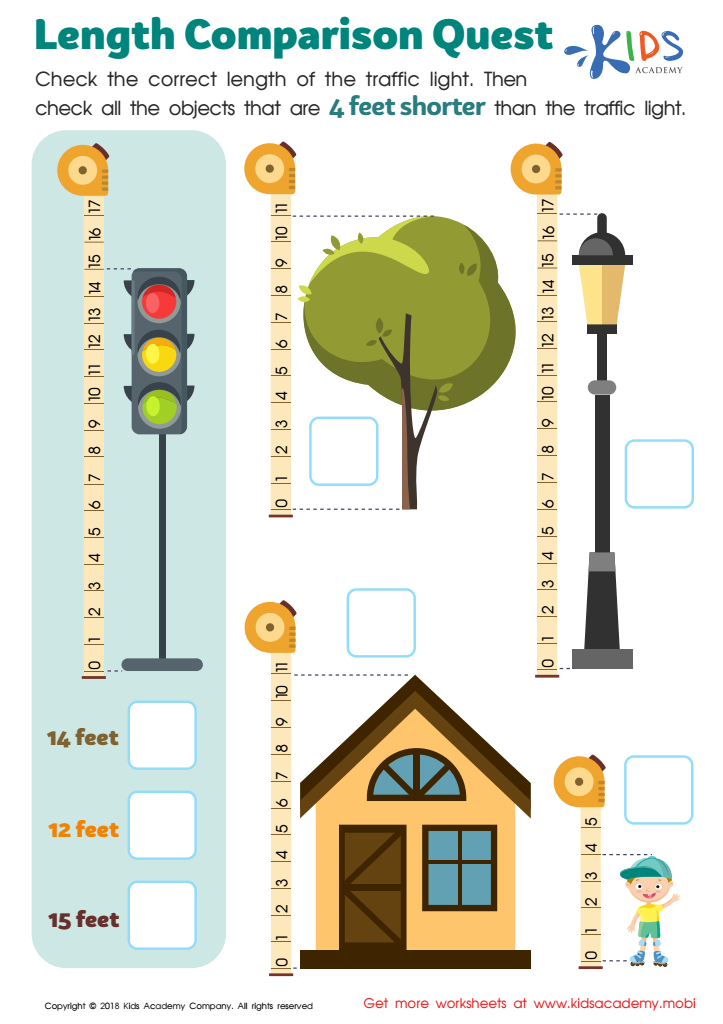

Length Comparison Quest Worksheet
Knowing measurement tools and how to use them is just the start. To be proficient, your kid must be able to accurately compare objects and their lengths. With the 'Length Comparison Quest' worksheet, they will check the correct length of the traffic light in the picture and then compare other objects to it, marking those that measure 4 feet shorter.
Length Comparison Quest Worksheet
Worksheet
 Assign to My Students
