Extra Challenge Graphs Worksheets for Ages 4-6
3 filtered results
-
From - To
Discover our "Extra Challenge Graphs Worksheets for Ages 4-6," designed to enhance young learners' early math skills! These engaging worksheets introduce children to fundamental graphing concepts, fostering critical thinking and problem-solving abilities. With vibrant visuals and age-appropriate activities, kids will explore concepts such as sorting, counting, and representing data in an interactive way. Perfect for parents and teachers seeking to provide additional challenges beyond the classroom, these resources promote hands-on learning while building confidence in math. Download our worksheets today and watch your child thrive as they embark on an exciting journey through the world of graphs and data representation!
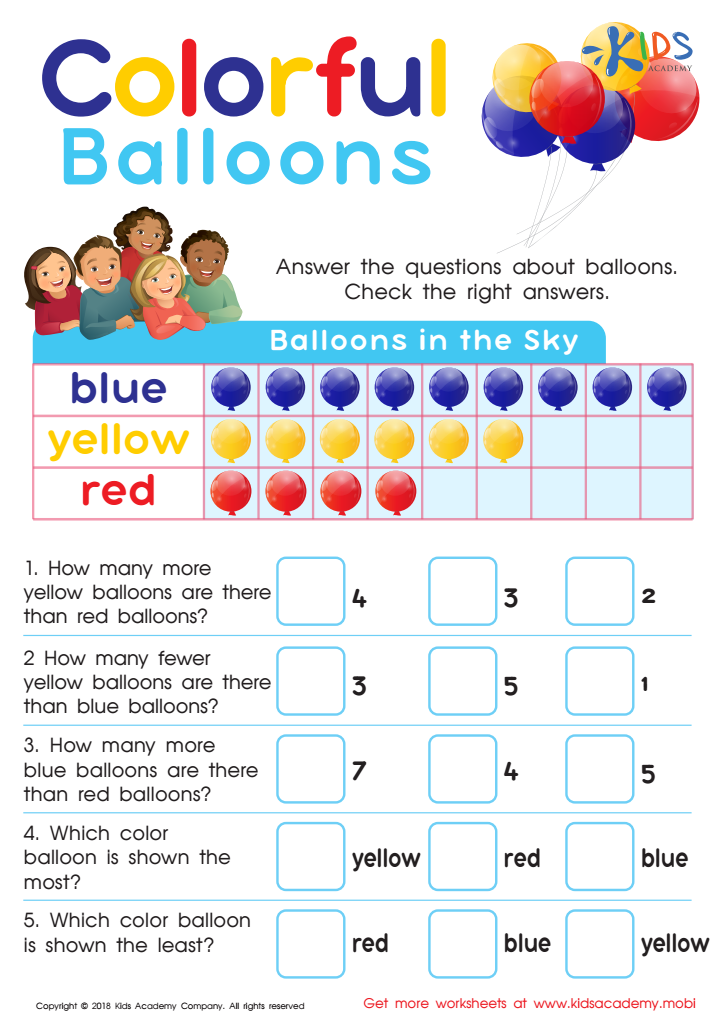

Picture Graphs: Colorful Balloons Worksheet
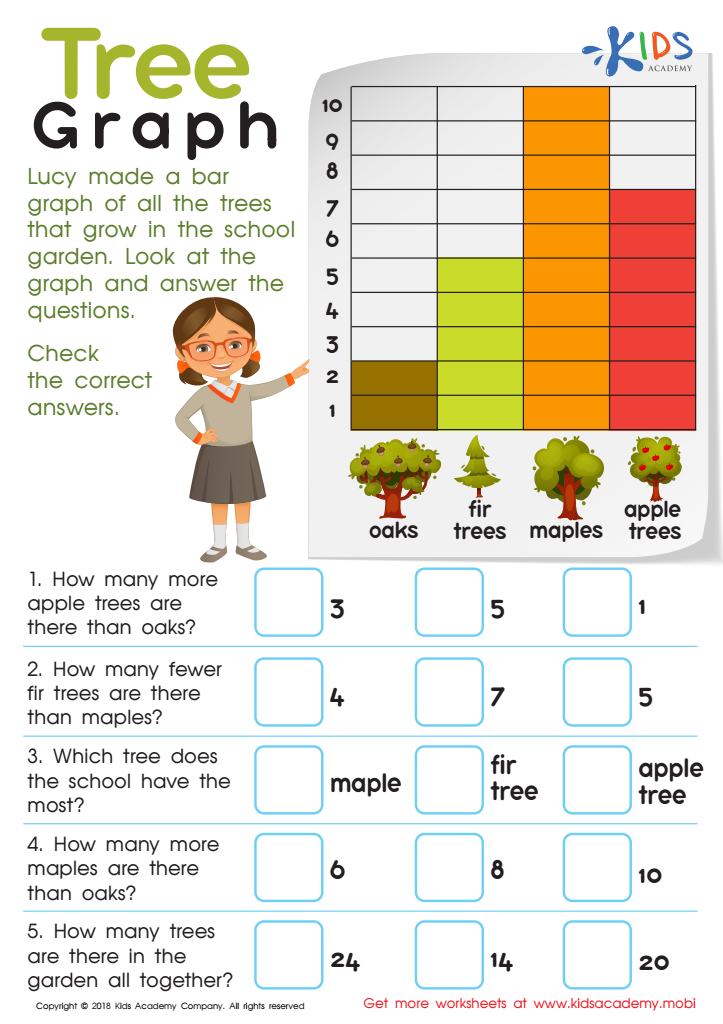

Tree Graph Worksheet
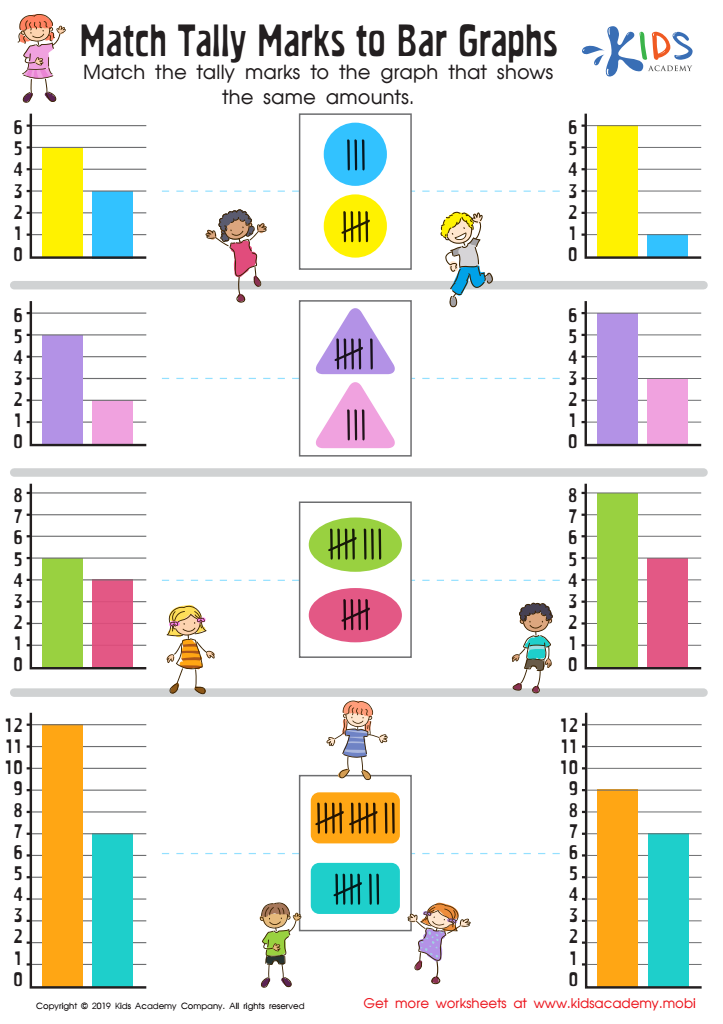

Match Tally Marks to Bar Graphs Worksheet
Extra Challenge Graphs for ages 4-6 are vital tools in early childhood education that promote the development of critical thinking, problem-solving, and data interpretation skills. These graphs engage young learners in making sense of information through visual representation, such as bar graphs or pictographs, which can simplify complex ideas while enhancing comprehension.
For parents and teachers, understanding these graphs can facilitate informed discussions about children's progress and abilities, enabling them to encourage individual growth. Using Extra Challenge Graphs aids in cultivating curiosity and enthusiasm for mathematics and science concepts, making learning fun and interactive. They also encourage collaboration, as children often work in groups to analyze and interpret data together, building social skills and teamwork.
Additionally, early engagement with graphing and analytical skills sets the foundation for future academic success. Children learn to recognize patterns, categorize data, and communicate findings effectively. By integrating Extra Challenge Graphs into daily activities, educators and parents instill a love for learning and demonstrate the importance of data literacy, which is increasingly essential in today’s information-driven world. Ultimately, embracing these tools fosters a curious mindset and equips children with lifelong skills needed in an ever-evolving society.
 Assign to My Students

