Data interpretation Extra Challenge Math Worksheets
3 filtered results
Difficulty Level
Grade
Age
-
From - To
Subject
Activity
Standards
Popularity
Favorites
With answer key
Interactive
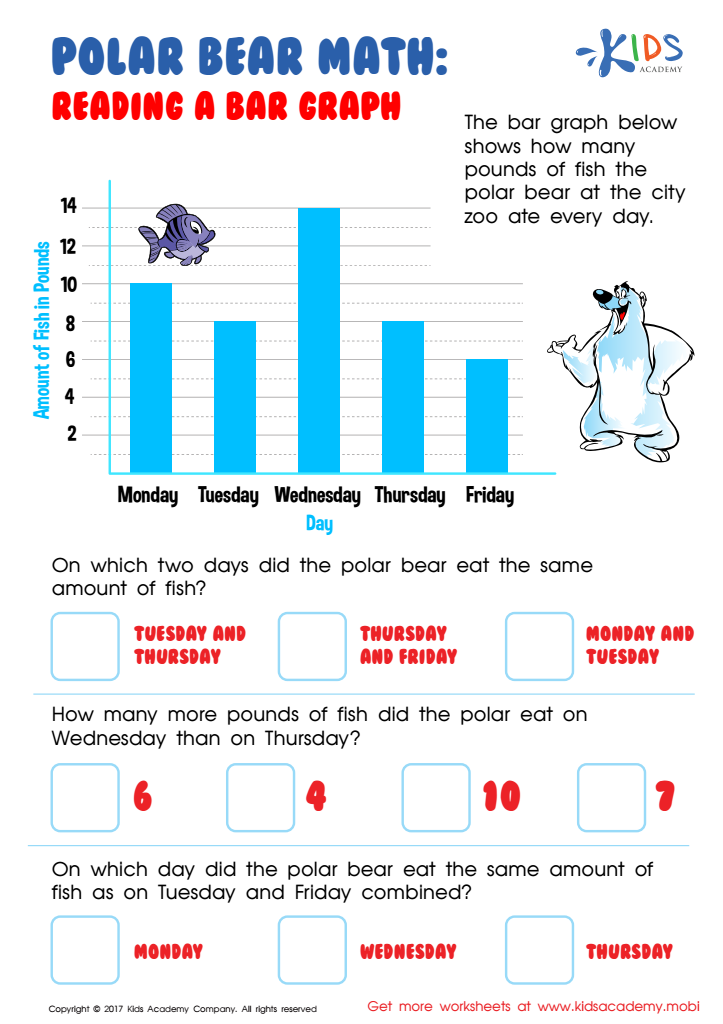

Reading Bar Graph Worksheet
Take your child north to practice data reading with a polar bear friend! This worksheet challenges 3rd graders to interpret data on a graph and solve related math problems.
Reading Bar Graph Worksheet
Worksheet
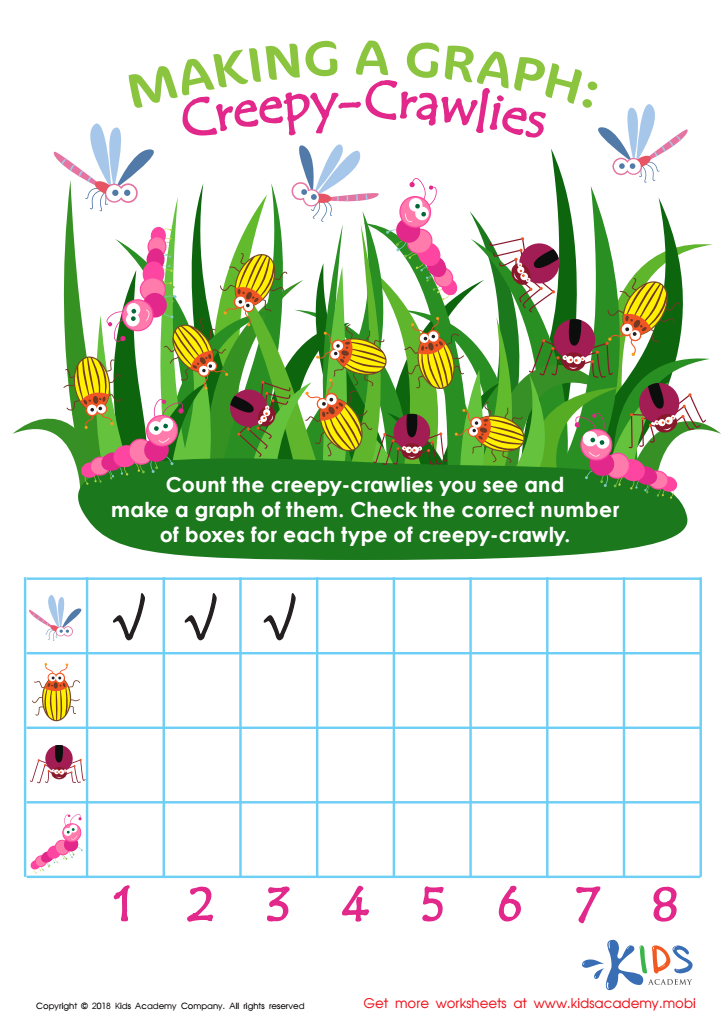

Making a Graph: Creepy Crawlies Worksheet
Let your little math whiz create a graph with this free PDF worksheet. They can count and sort the creepy-crawlies, checking off the correct number of boxes for each type. This engaging activity will help them hone their visual discrimination skills while efficiently organizing data.
Making a Graph: Creepy Crawlies Worksheet
Worksheet
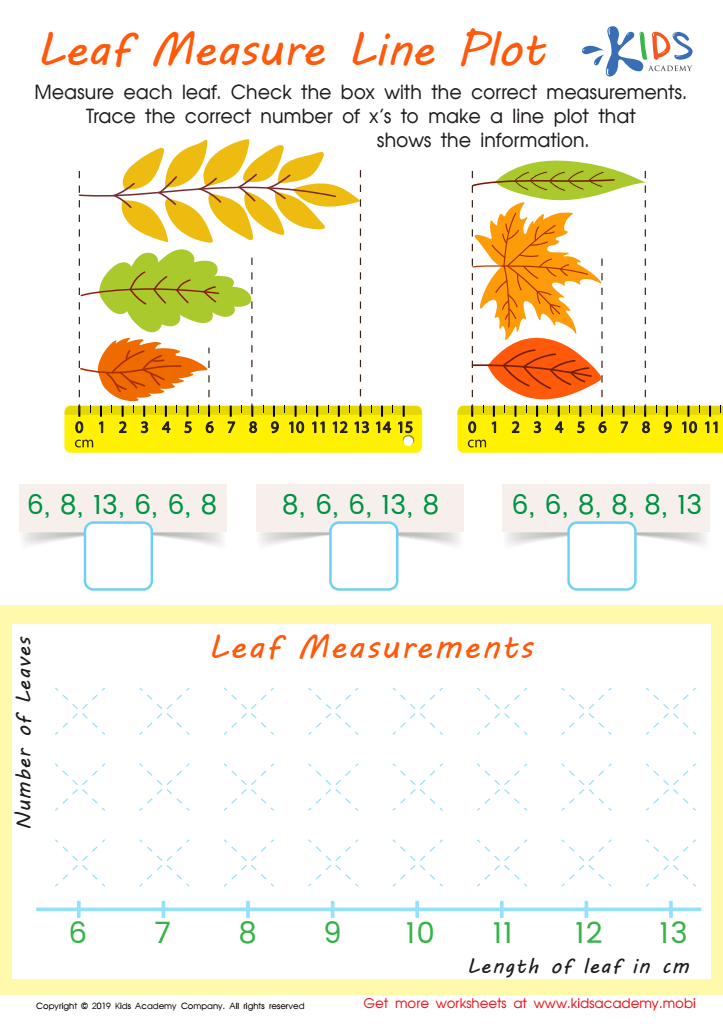

Leaf Measure Line Plot Worksheet
Help your third grader measure each of the four leaves, and check the box with the correct measurements. Then, trace the right number of x's to make a line plot showing the data. This exercise will engage your students and make it easier for them to grasp the concept of line plots.
Leaf Measure Line Plot Worksheet
Worksheet
 Assign to My Students


.jpg)


