2.MD.D.9 Measurement and Data worksheets for Grade 2
12 filtered results
Difficulty Level
Grade
Age
-
From - To
Subject
Activity
Standards
2.MD.D.9
Generate measurement data by measuring lengths of several objects to the nearest whole unit, or by making repeated measurements of the same object. Show the measurements by making a line plot, where the horizontal scale is marked off in whole-number units.
Favorites
With answer key
Interactive
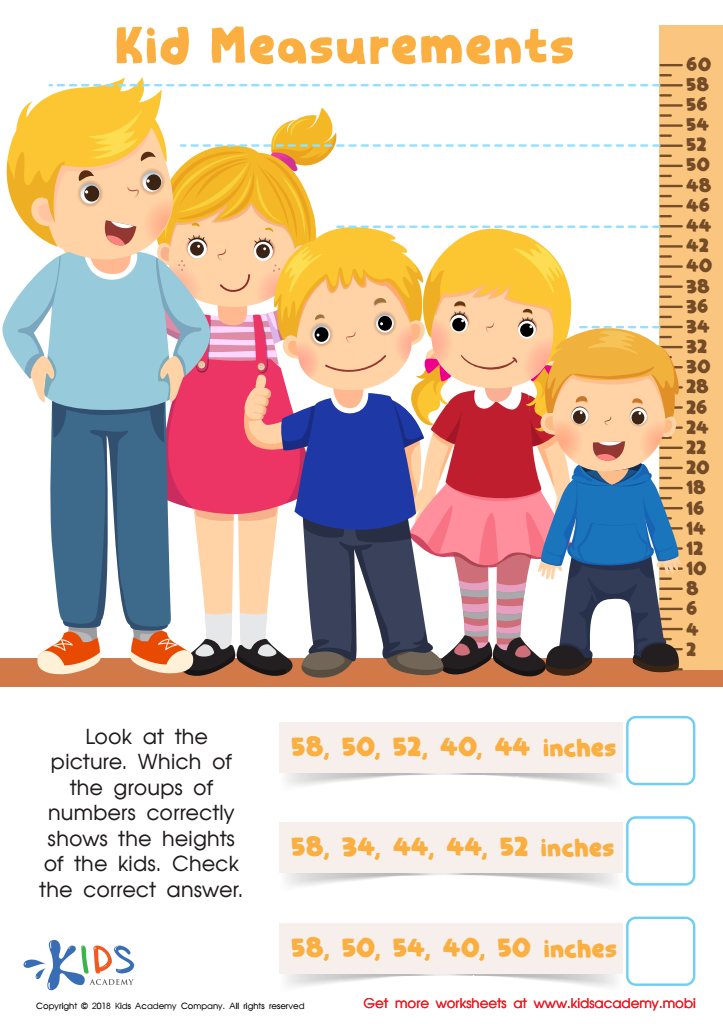

Kids Measurements Worksheet
Help your kids look at the groupings on the bottom right of the worksheet. Compare the heights of the kids shown in the picture to the numbers in each group. Have them check which of the groups of numbers correctly shows the heights.
Kids Measurements Worksheet
Worksheet
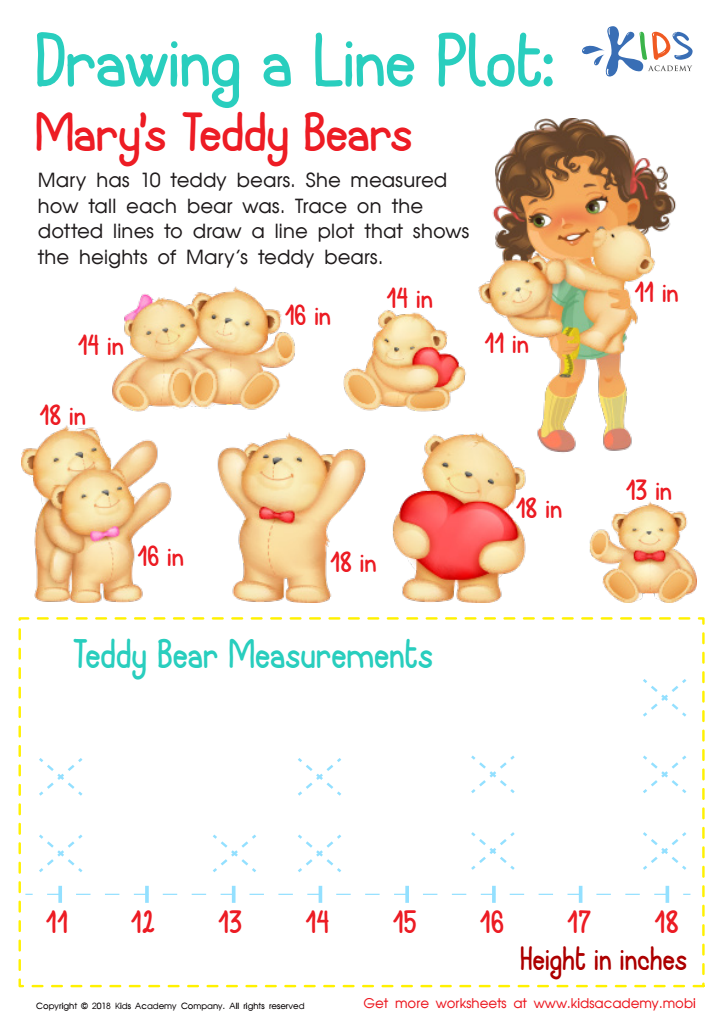

Drawing and Line Plot: Mary's Teddy Bears Worksheet
This worksheet teaches kids to draw and interpret line plots. Mary has 10 teddy bears and has measured their heights. Ask your child to draw a line plot showing the heights of Mary's teddy bears. It's a great way for little ones to learn how to organize information quickly and correctly.
Drawing and Line Plot: Mary's Teddy Bears Worksheet
Worksheet
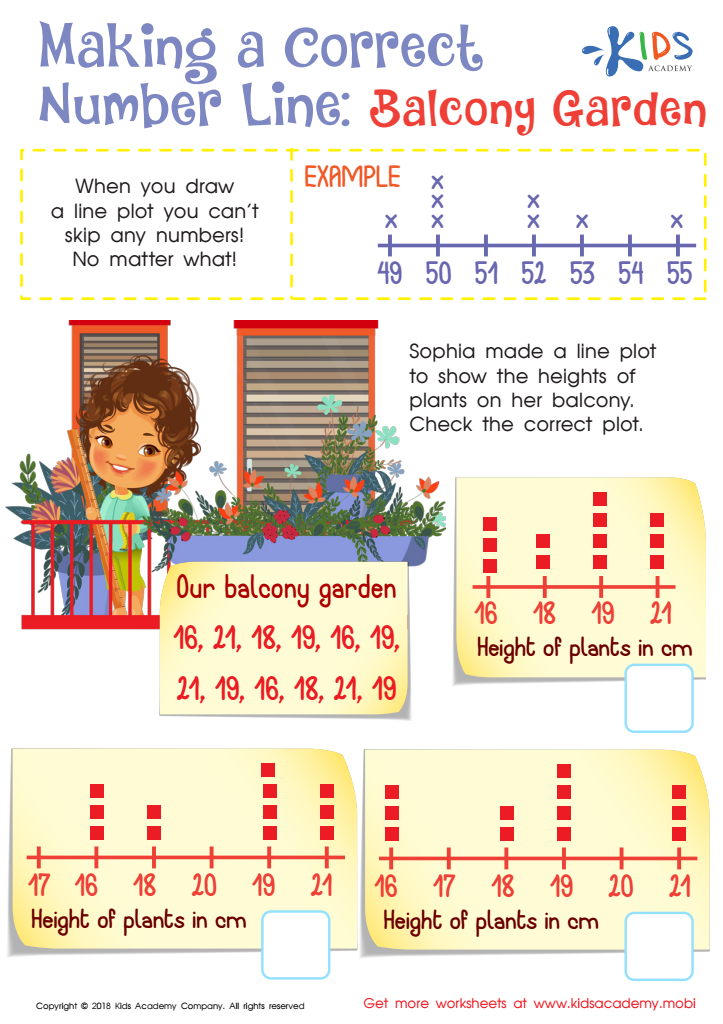

Making a Correct Number Line: Balcony Garden Worksheet
Teach your child to draw and identify a line plot with this worksheet. Have them help Sophia check her plot for the heights of plants in her balcony, ensuring no numbers are skipped. Line plots are a great way to quickly organize information and an essential skill your child needs.
Making a Correct Number Line: Balcony Garden Worksheet
Worksheet


What Is a Line Plot? Worksheet
A line plot is an ideal method to organize data. For example, if your child needs to arrange objects for easy recognition, draw a line plot. This worksheet can help teach the skill. Kids must identify correct pictures that display line plots.
What Is a Line Plot? Worksheet
Worksheet
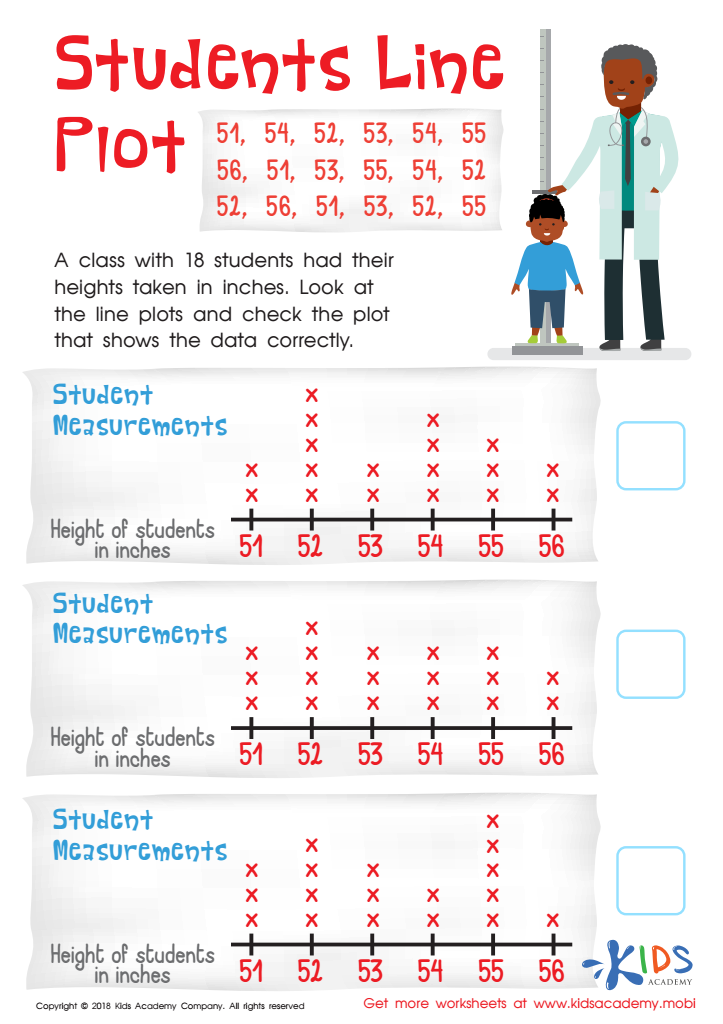

Students Line Plot Worksheet
Help your students learn to draw a line plot correctly by giving real examples. In this exercise, they must check the data of a class of 18 students' heights (in inches). Have them compare two line plots and figure out which one is correct.
Students Line Plot Worksheet
Worksheet
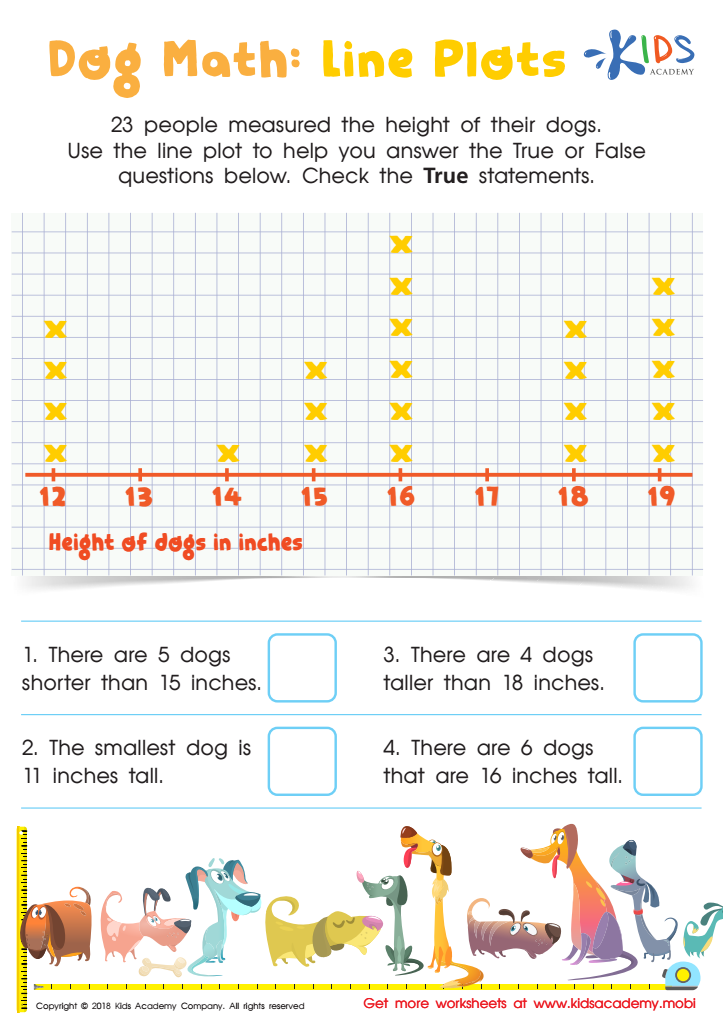

Dog Math: Line Plots Worksheet
Do your kids love dogs? If you have family pets, your kids may be excited to do this worksheet. It involves a line plot and True/False questions about 23 people measuring their dogs' heights. Assist your kids in verifying the statements that are True.
Dog Math: Line Plots Worksheet
Worksheet
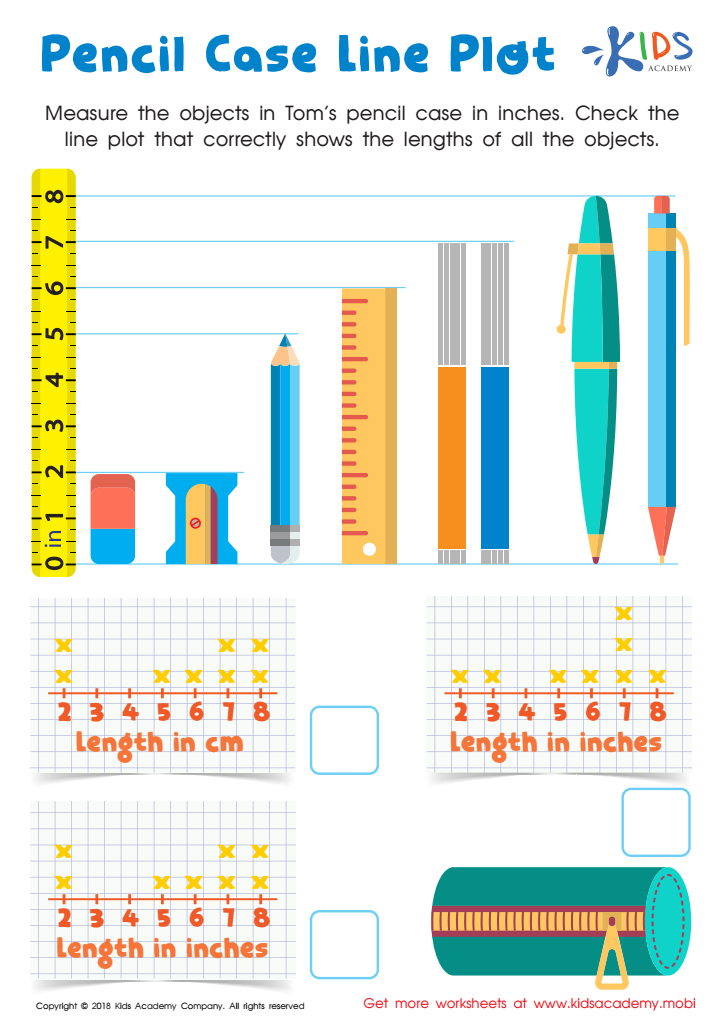

Pencil Case Line Plot Worksheet
Explain to your child that a line plot is a way to organize information. For example, if they need to arrange objects, they should draw a line plot. Now, have them help Tom measure the objects in his pencil case in inches. Then, have them check the line plot that accurately shows the length.
Pencil Case Line Plot Worksheet
Worksheet
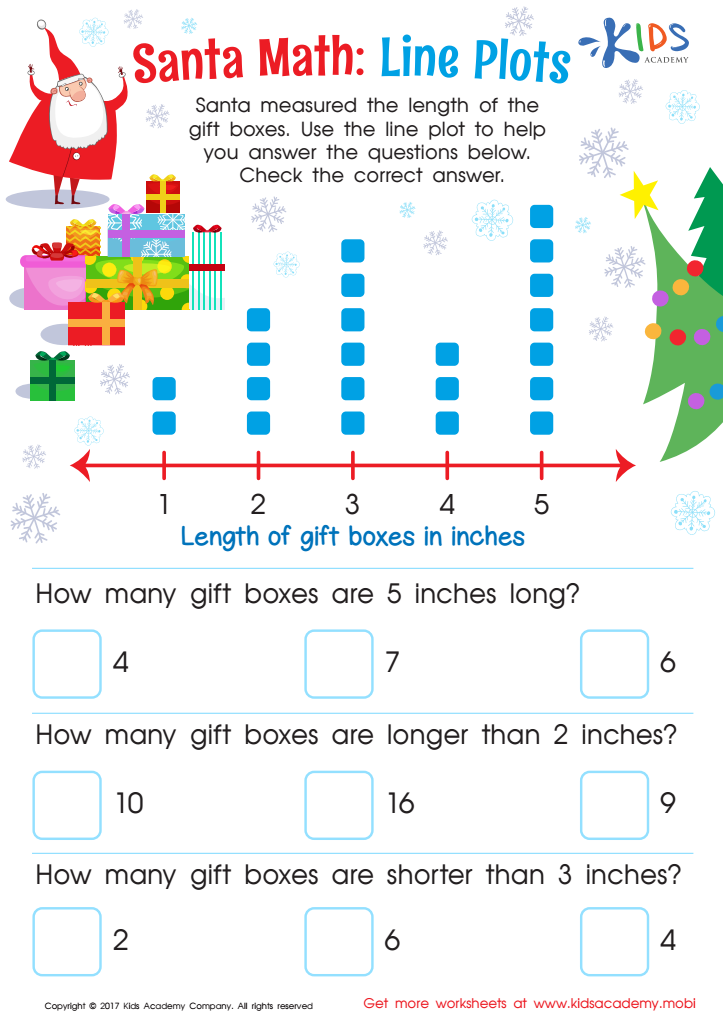

Line Plot Worksheet
Help your child measure presents with Santa using this 2nd grade line plot worksheet! It's a fun way to boost math skills and analyze data. Plus, it's sure to delight your child!
Line Plot Worksheet
Worksheet
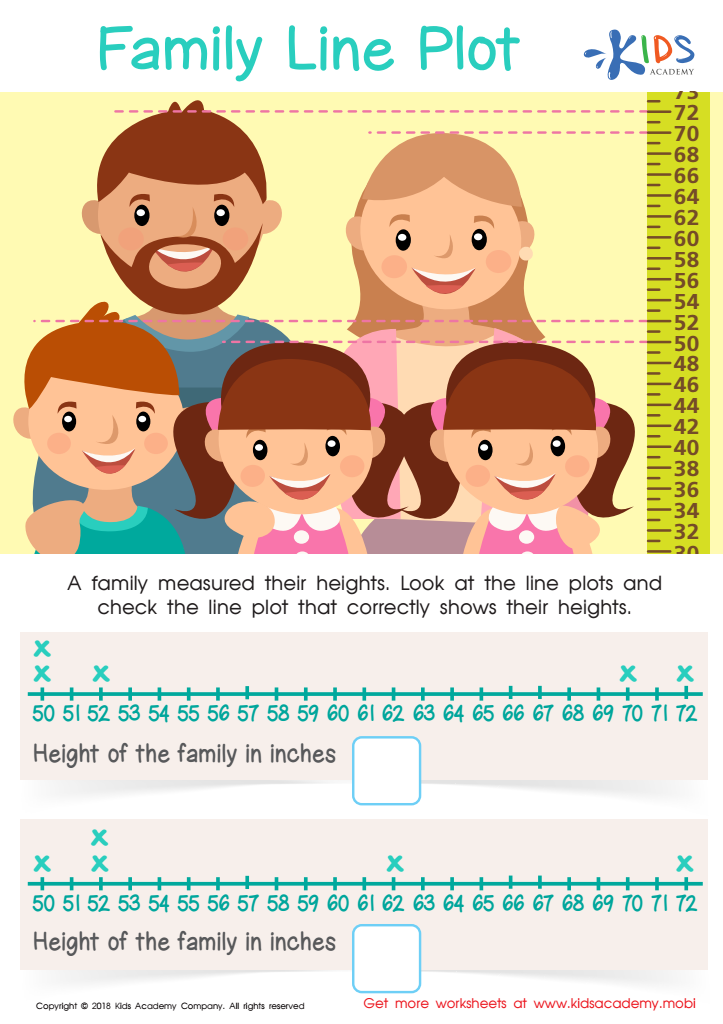

Family Line Plot Worksheet
Have you and your kids ever done a family height measurement? How did it go? If they're familiar with it, this worksheet may be simpler. The picture shows a family with their heights recorded. Get your kid to look at the line plots and choose the one that shows the family's heights accurately.
Family Line Plot Worksheet
Worksheet
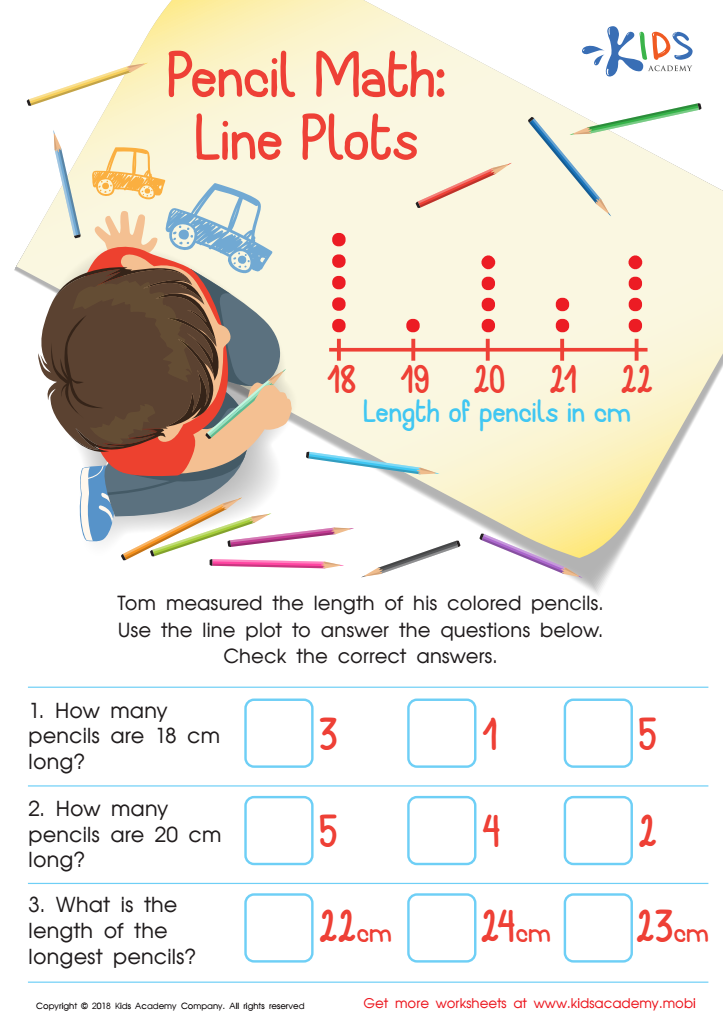

Pencil Math: Line Plots Worksheet
Your child will meet Tom in this worksheet, helping him find the length of his colored pencils. Tom has written the lengths in cm, and the line plot will help your kids answer the questions. Check the correct answers for each, including how many pencils are of a certain length. The line plot makes it easy to find the answers.
Pencil Math: Line Plots Worksheet
Worksheet
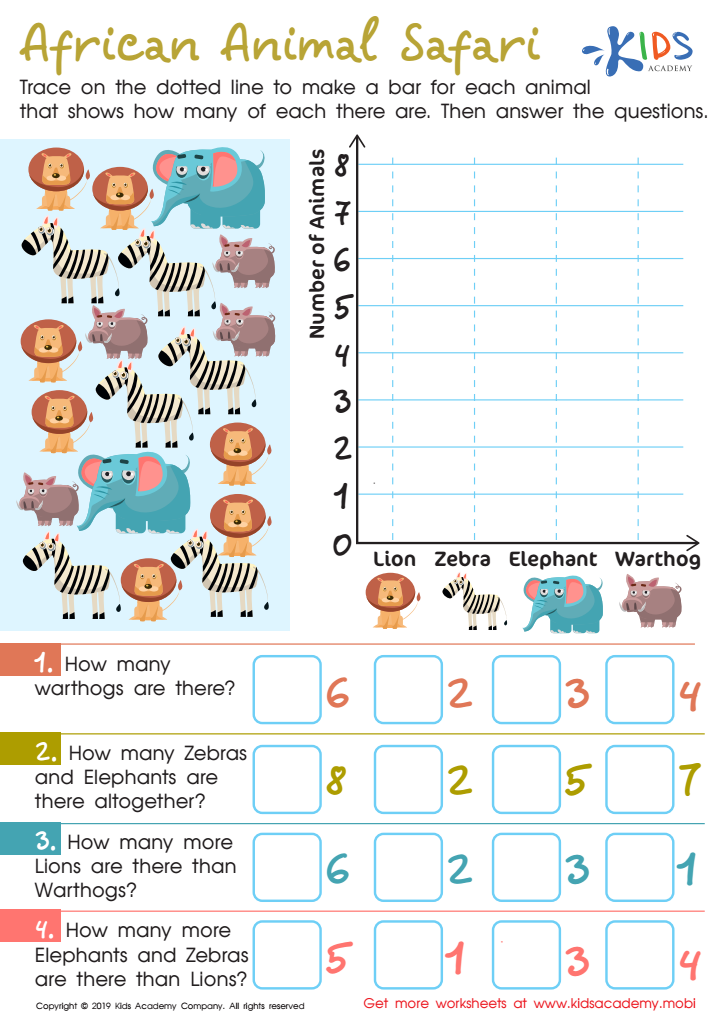

African Animal Safari Worksheet
Help students learn geography and math, with this worksheet. Examine the graph and ask your students questions. Have them answer using the graph and addition/subtraction exercises. This can help them name continents, countries, and animals unique to each.
African Animal Safari Worksheet
Worksheet
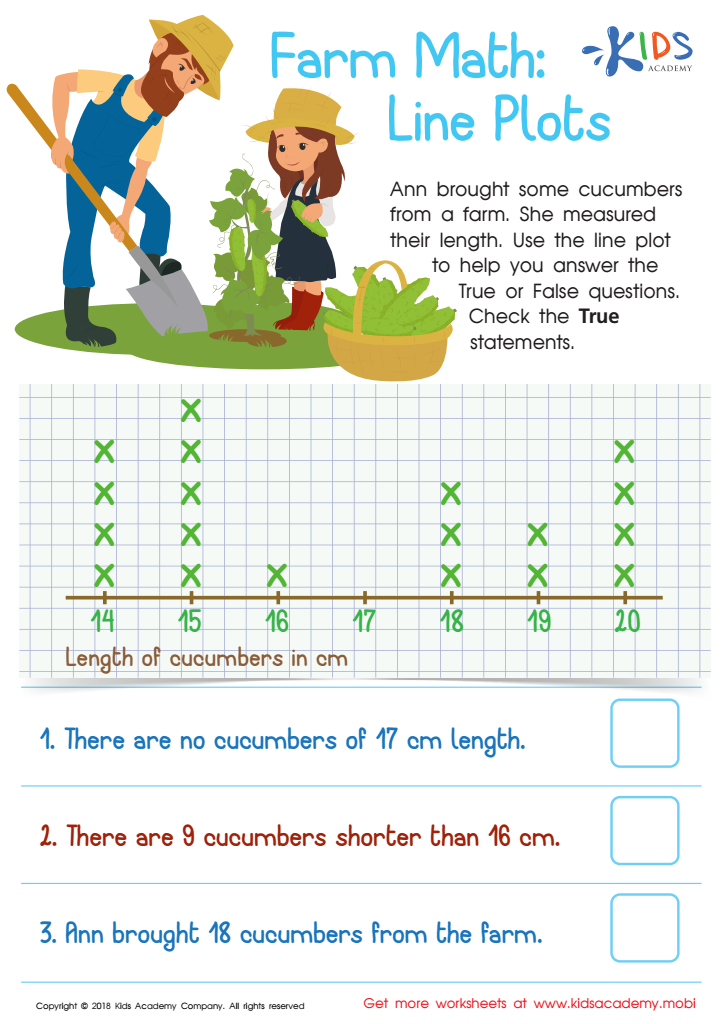

Farm Math: Line Plots Worksheet
Ann brought cucumbers from a farm and measured their length. She drew a line plot for your students to use to answer True/False questions about the number and length of the cucumbers. Ask your students to check only the True statements. (80 words)
Farm Math: Line Plots Worksheet
Worksheet
 Assign to My Students


