Interpreting data Easy Worksheets for Ages 3-8
3 filtered results
-
From - To
Discover our "Interpreting Data Easy Worksheets for Ages 3-8," designed to spark young learners' curiosity and enhance their analytical skills! These engaging worksheets introduce children to basic data interpretation concepts through fun activities like sorting, matching, and analyzing visual information. Perfect for preschool and early elementary students, each worksheet encourages critical thinking while aligning with educational standards. With colorful visuals and interactive exercises, these resources make learning enjoyable and accessible. Help your child develop essential math and problem-solving skills early on! Explore our collection and empower your kids to understand and interpret data with confidence and creativity today!
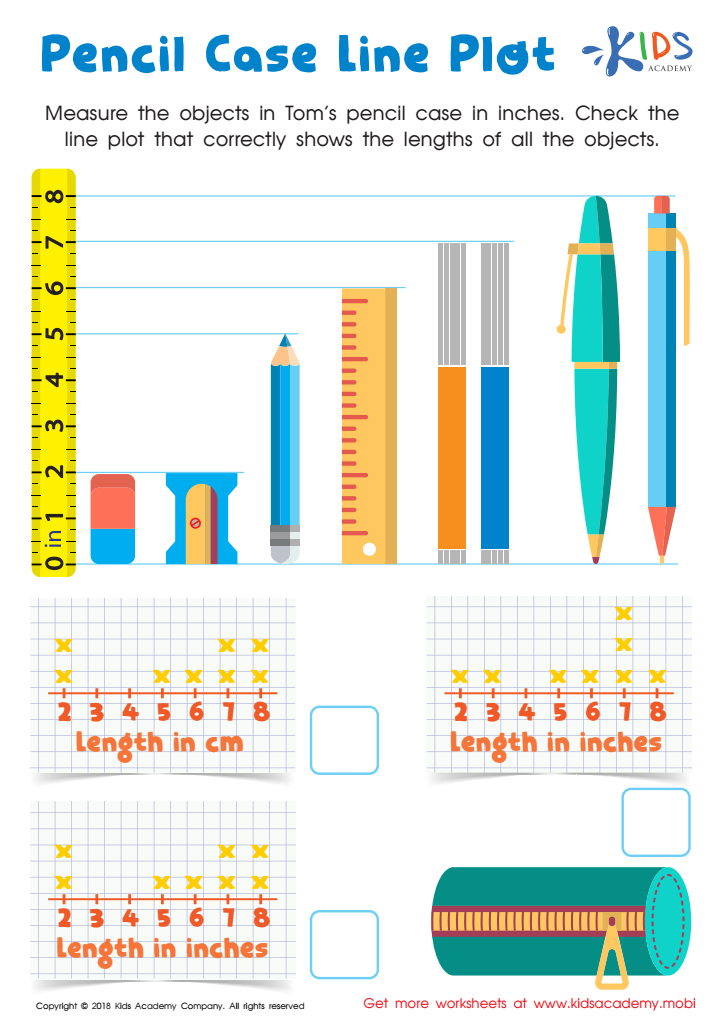

Pencil Case Line Plot Worksheet
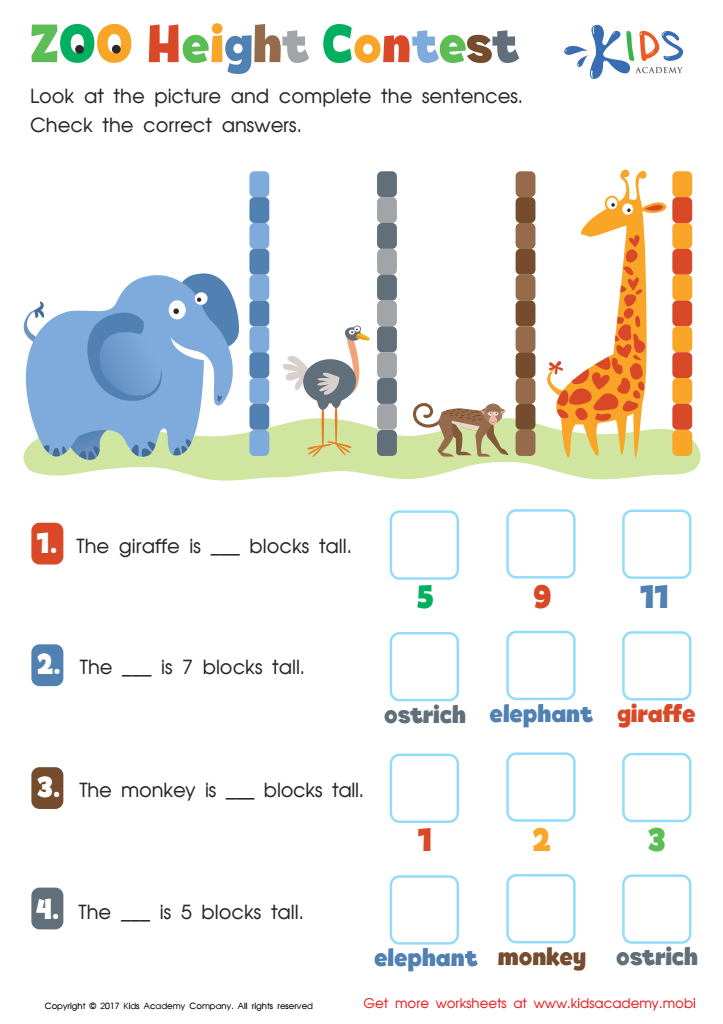

Zoo Height Contest Worksheet
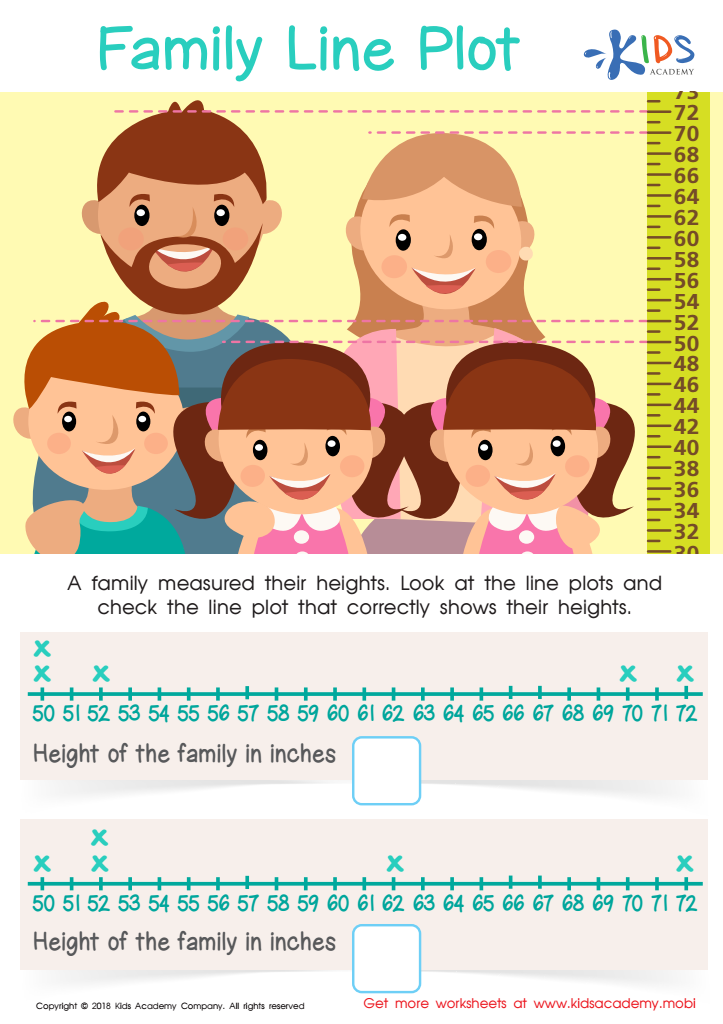

Family Line Plot Worksheet
Interpreting data is an essential skill in today's world, and it’s increasingly important for parents and teachers to introduce this concept to children aged 3-8. Understanding data helps young learners make sense of their environment by recognizing patterns, similarities, and differences. For instance, when parents collect information on their child’s favorite color, they can create a simple chart that visually illustrates popularity among friends, making learning engaging and relatable.
Moreover, learning data interpretation at an early age fosters critical thinking skills. As children start asking questions about what the data shows – such as “Why does blue have more votes?” – they learn to analyze information, reason through problems, and draw conclusions. This process encourages curiosity and enhances decision-making abilities.
In addition, fostering awareness of data encourages children to express their thoughts and opinions in a constructive way. It can empower them to engage with topics around them, from weather patterns to counting toys, laying a foundation for future math and science understanding. By prioritizing data interpretation, parents and teachers set the stage for lifelong skills that help children navigate an increasingly data-driven world.
 Assign to My Students


