Interpreting data Easy Worksheets for Ages 7-9
3 filtered results
-
From - To
Unlock your child's potential with our "Interpreting Data Easy Worksheets for Ages 7-9." Designed to make learning fun, these worksheets help young learners grasp key data interpretation concepts effortlessly. Featuring engaging activities like reading charts, graphs, and tables, each exercise is crafted to build confidence and enhance analytical skills. Perfect for home or classroom use, these worksheets cater to individual learning styles, making education both effective and enjoyable. Whether your child is advanced or needs extra practice, our expertly designed resources support their educational journey every step of the way. Explore today and watch them thrive in understanding data!

Pencil Case Line Plot Worksheet

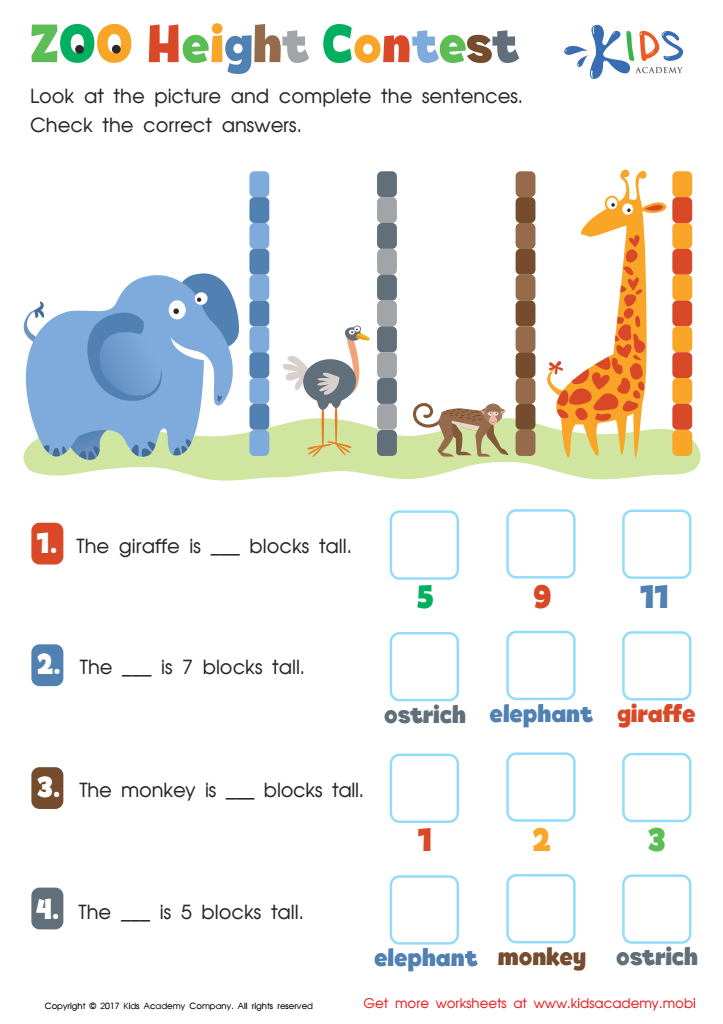
Zoo Height Contest Worksheet

Family Line Plot Worksheet


Interpreting data is an essential skill for children aged 7-9, and parents and teachers should prioritize helping them develop this ability. At its core, interpreting data involves understanding, analyzing, and making sense of information presented in various forms—such as graphs, charts, and tables. Developing this skill at an early age builds a strong foundation for critical thinking, problem-solving, and informed decision-making in all areas of life.
For parents, encouraging their children to interpret data helps them excel academically, particularly in math and science. It also fosters a sense of curiosity and encourages children to ask questions about the world around them. Parents can engage their children with age-appropriate activities like counting and organizing household items, recognizing patterns in nature, or using simple charts for homework assignments.
Teachers also play a vital role in nurturing data interpretation skills. Using interactive and visual teaching tools can make data interpretation engaging and fun for young learners. Educational software, classroom experiments, and collaborative projects can help solidify these concepts, making them relatable and easier to grasp. By mastering these skills early on, children are better prepared for more complex academic challenges ahead and become equipped with the analytical tools necessary for daily life.
Overall, these skills are invaluable—knowing how to interpret data enables children to make well-informed decisions, understand diverse viewpoints, and navigate a data-driven world effectively.