Unlock the world of data interpretation with our engaging Easy Worksheets designed for children ages 8-9! These specially crafted resources help young learners develop essential skills in analyzing and understanding data through fun, interactive activities. Students will explore pictographs, bar graphs, and simple charts that stimulate critical thinking and enhance numeracy. Aligned with educational standards, our worksheets provide a perfect blend of challenge and enjoyment, ensuring that children not only grasp fundamental concepts but also boost their confidence in math. Foster a love for data and analytical skills in your classroom today with our comprehensive collection of easy-to-use worksheets!

Check out this FREE "Data interpretation" Trial Lesson for age 8-9!

Picture Graphs Word Problems

Favorites
With answer key
Interactive
  • 8-9
  • Data interpretation
  • Easy
Fruit Math: Picture Graphs Worksheet

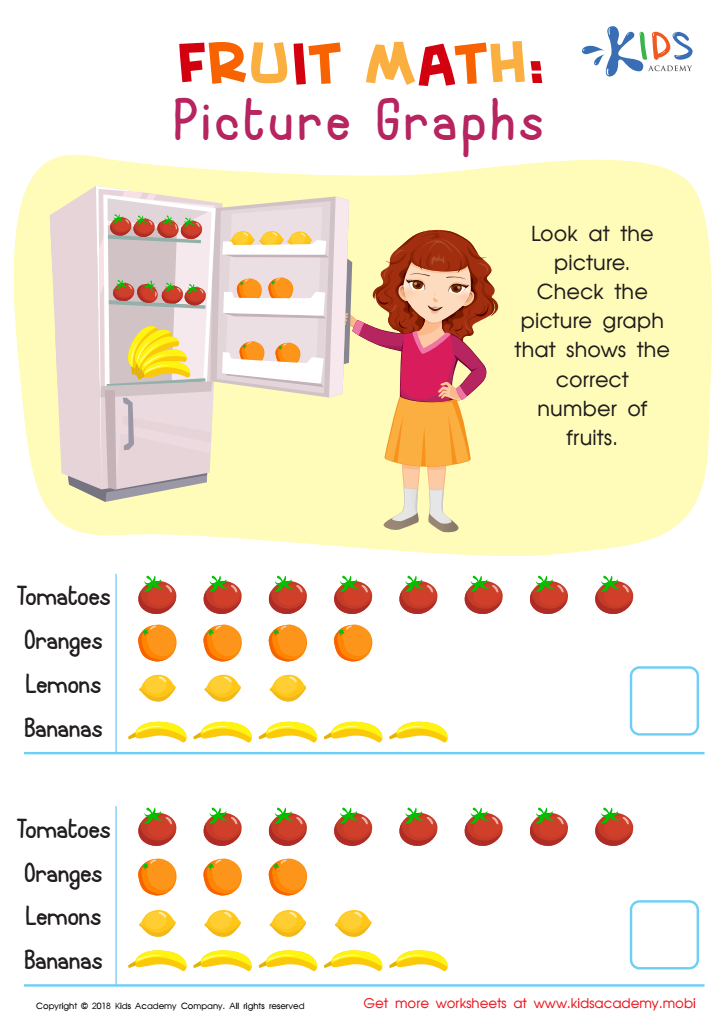
Fruit Math: Picture Graphs Worksheet

Help your child learn to draw graphs by having them look at pictures. Ask them to identify a graph that accurately portrays the data and have them explain why. This will prepare them to easily draw more complex graphs in the future. For example, have them look at the picture with the number of fruits in the colorful worksheet and explain why the graph is accurate.
Fruit Math: Picture Graphs Worksheet
Worksheet
Students Line Plot Worksheet

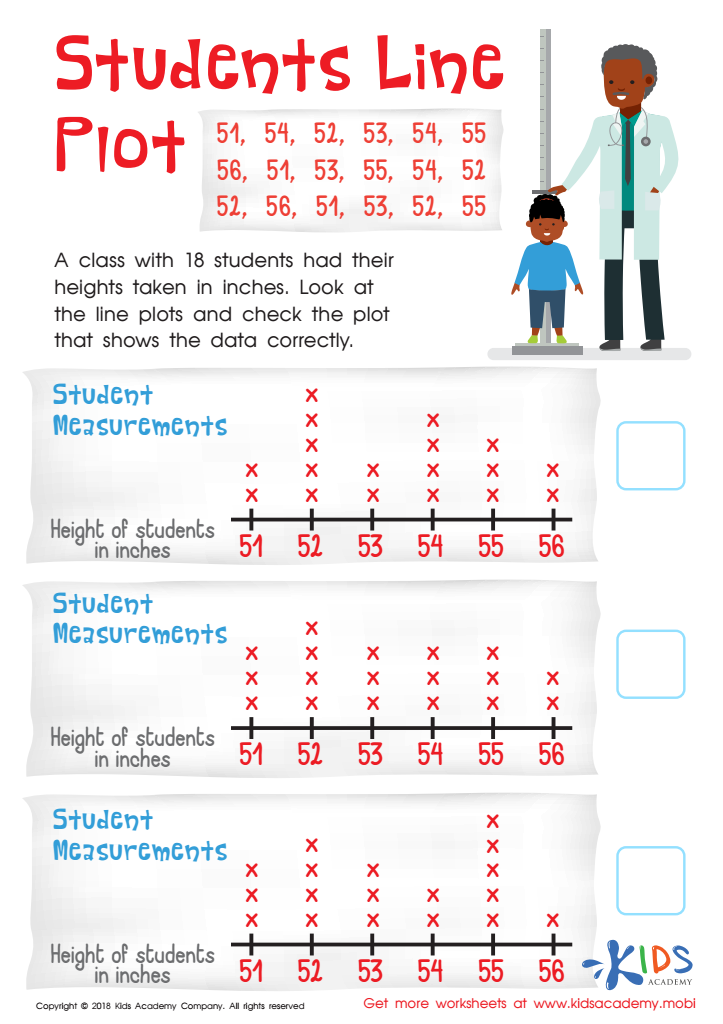
Students Line Plot Worksheet

Help your students learn to draw a line plot correctly by giving real examples. In this exercise, they must check the data of a class of 18 students' heights (in inches). Have them compare two line plots and figure out which one is correct.
Students Line Plot Worksheet
Worksheet
Dog Math: Line Plots Worksheet

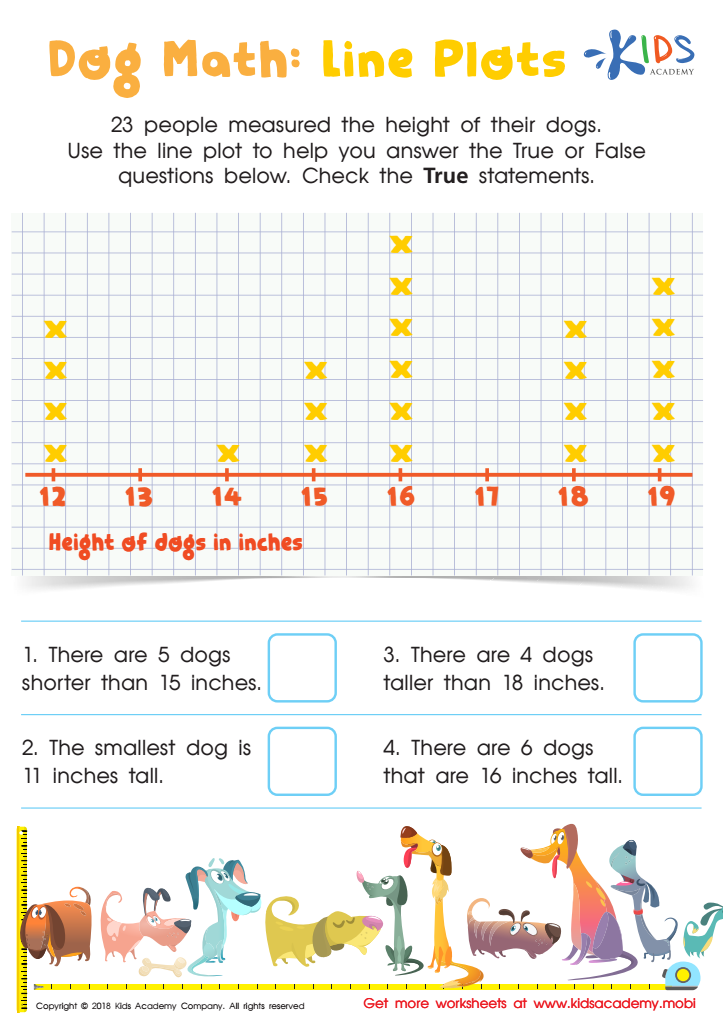
Dog Math: Line Plots Worksheet

Do your kids love dogs? If you have family pets, your kids may be excited to do this worksheet. It involves a line plot and True/False questions about 23 people measuring their dogs' heights. Assist your kids in verifying the statements that are True.
Dog Math: Line Plots Worksheet
Worksheet
Coffeehouse Survey: Picture Graph Word Problems Worksheet


Coffeehouse Survey: Picture Graph Word Problems Worksheet

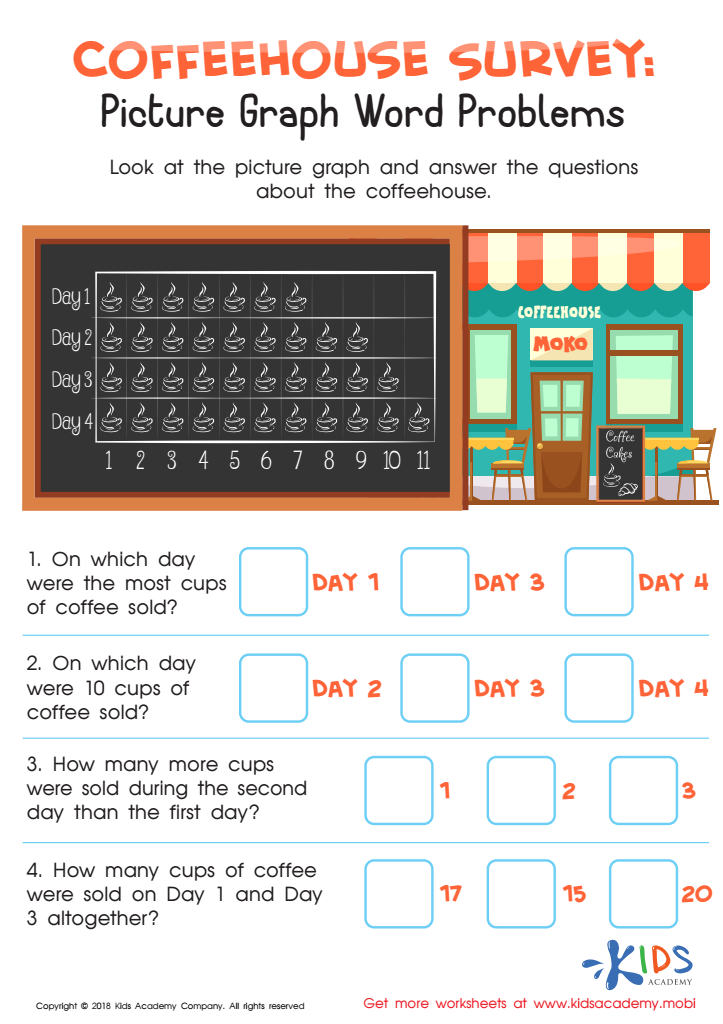
This coffeehouse survey helps children interpret pictures and answer questions. Your child will look at a picture graph displaying daily coffee cup sales from Day 1 to Day 4. Aid them in answering questions on the number of cups sold and which day had the most sales.
Coffeehouse Survey: Picture Graph Word Problems Worksheet
Worksheet
Aircraft Carrier Picture Graphs Worksheet

Aircraft Carrier Picture Graphs Worksheet

Kids love learning about jets and boats with this awesome worksheet! It's a great way to engage them as they work on picture graphs. Representing numerical values with pictures, this free PDF requires them to choose which picture graph and representation best match the carrier in the picture. It's also great practice for visual discrimination!
Aircraft Carrier Picture Graphs Worksheet
Worksheet
Pencil Math: Line Plots Worksheet

Pencil Math: Line Plots Worksheet

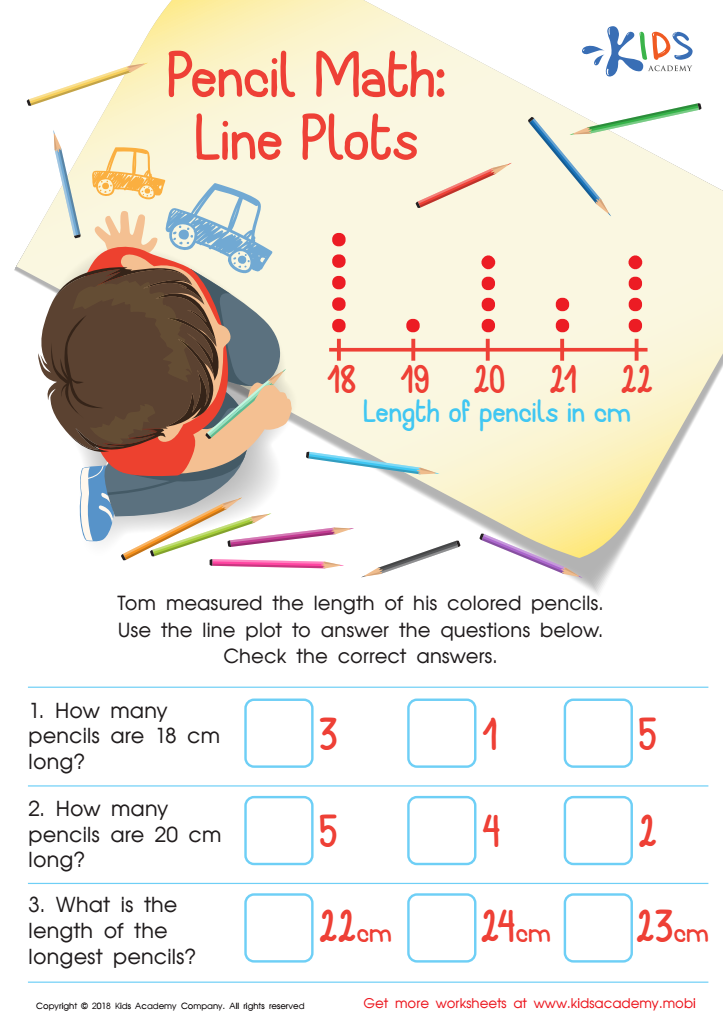
Your child will meet Tom in this worksheet, helping him find the length of his colored pencils. Tom has written the lengths in cm, and the line plot will help your kids answer the questions. Check the correct answers for each, including how many pencils are of a certain length. The line plot makes it easy to find the answers.
Pencil Math: Line Plots Worksheet
Worksheet
Pet Survey Worksheet

Pet Survey Worksheet

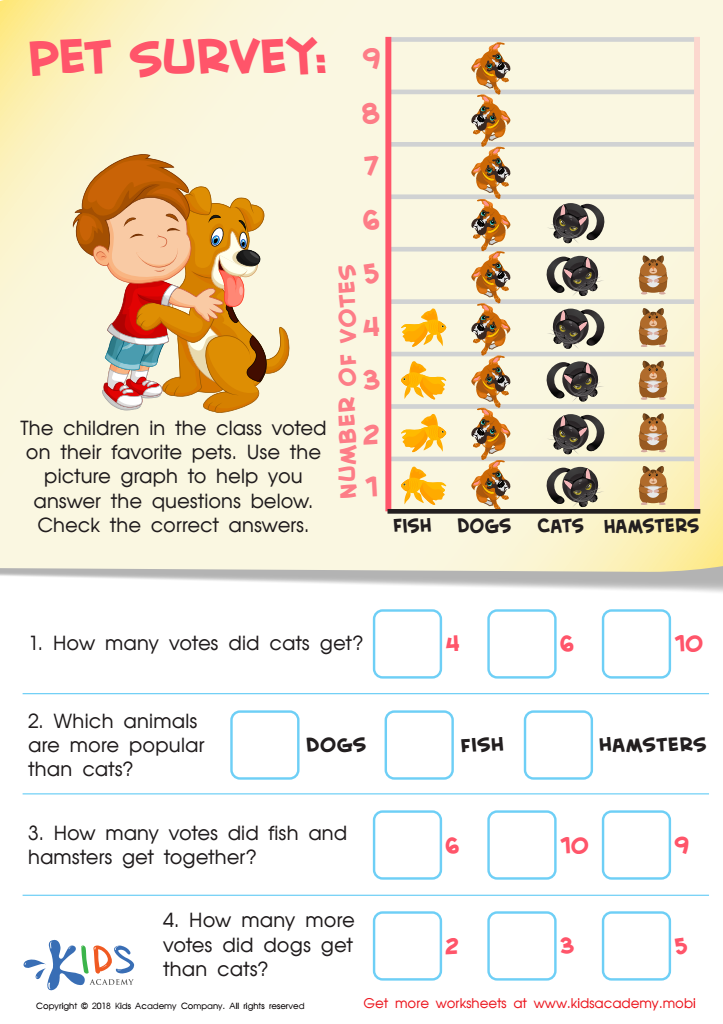
Do you have a furry family member? If the answer is yes and your kids love animals, they'll enjoy this worksheet. The picture graph shows the children's votes for their favorite pet - fish, dog, cat and hamster. Ask your child to use the graph to answer the questions. Guide them to check the right answer.
Pet Survey Worksheet
Worksheet
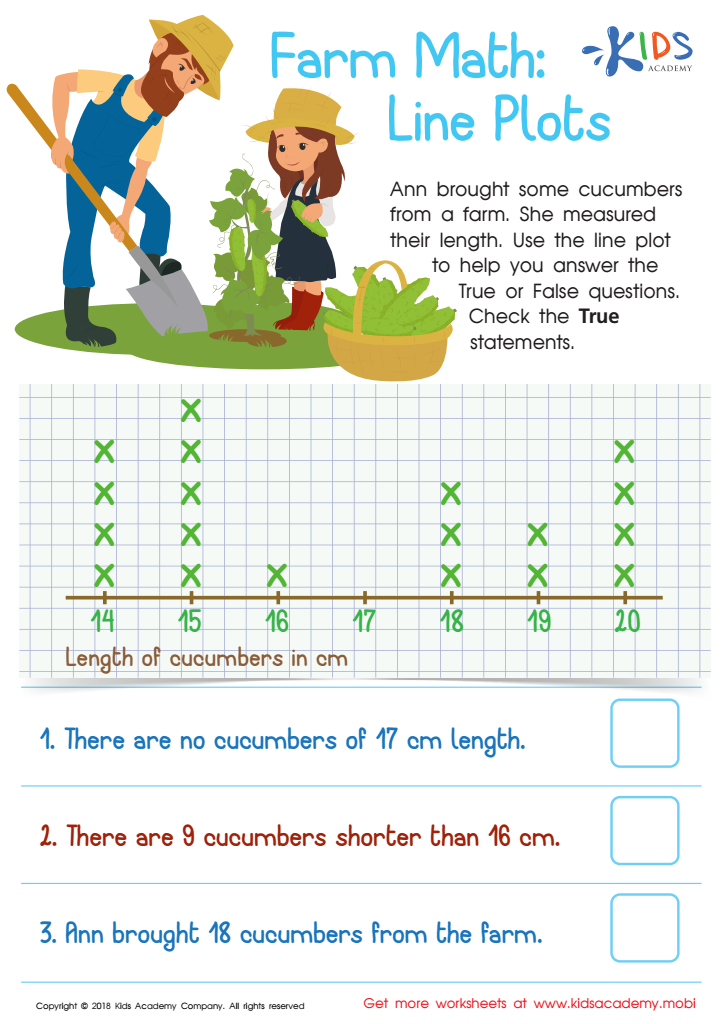
Farm Math: Line Plots Worksheet

Farm Math: Line Plots Worksheet

Ann brought cucumbers from a farm and measured their length. She drew a line plot for your students to use to answer True/False questions about the number and length of the cucumbers. Ask your students to check only the True statements. (80 words)
Farm Math: Line Plots Worksheet
Worksheet


Data interpretation is an essential skill for kids aged 8-9, and both parents and teachers should prioritize it for several reasons. First, data helps children make sense of the world around them. By learning how to read and understand graphs, charts, and simple statistics, kids can grasp important information about topics like weather patterns, sports scores, and population growth. This builds their critical thinking skills.

Second, understanding data encourages curiosity and asks questions. If a child sees that more people prefer pizza over burgers, they might wonder why. This promotes research and discovery, helping them become active learners.

Additionally, data interpretation lays the groundwork for math skills. When kids practice sorting, organizing, and analyzing data, they improve their ability to understand numbers and even advance in math concepts.

Lastly, these skills are crucial as children grow older. As technology and information become more central in daily life, knowing how to interpret data will help them make informed decisions in school and beyond. Ultimately, by supporting children's understanding of data, parents and teachers empower them to think critically, ask questions, and explore the world with confidence!