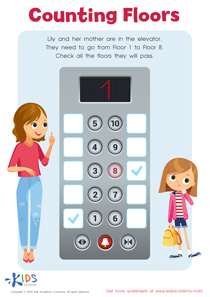
Interpreting data Extra Challenge Graphs Worksheets for Ages 3-8
3 filtered results
-
From - To
Introducing our "Interpreting Data Extra Challenge Graphs Worksheets" designed for children aged 3-8, these engaging worksheets provide a fun way to develop important analytical skills. Tailored to young learners, this collection encourages them to interpret and analyze various types of graphs, enhancing their understanding of data in a visually appealing format. Through colorful illustrations and interactive tasks, children will learn to categorize, compare, and draw conclusions from data, making math enjoyable and accessible. Perfect for home or classroom use, these worksheets offer extra challenges that inspire critical thinking while building a solid foundation in math skills. Get started today!
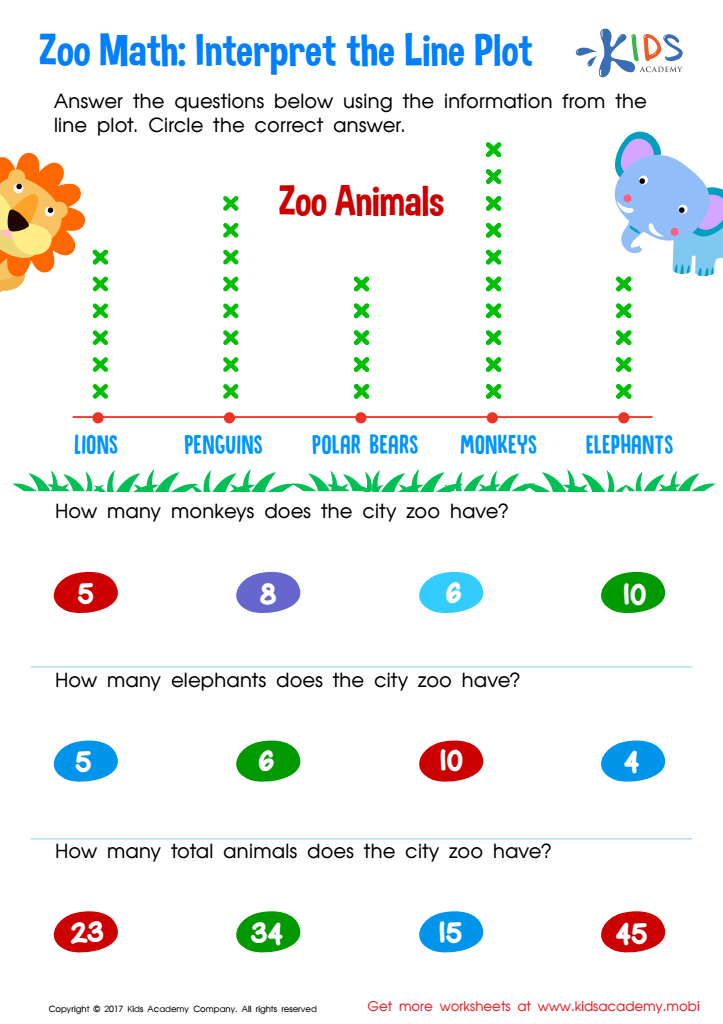

Interpret Line Plot Worksheet
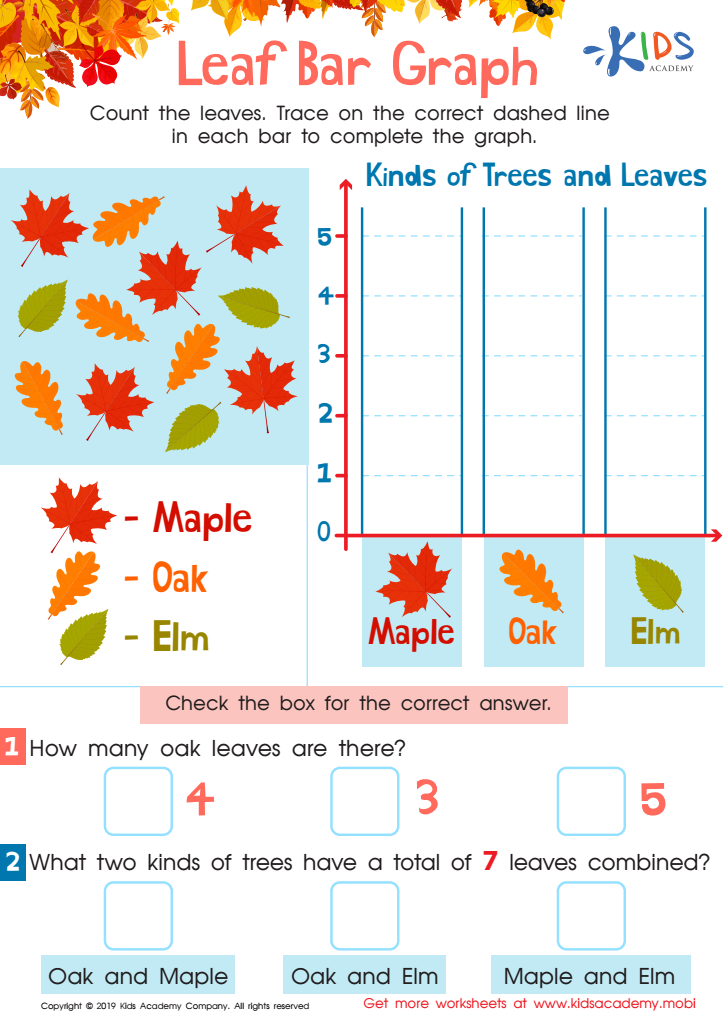

Leaf Bar Graph Worksheet
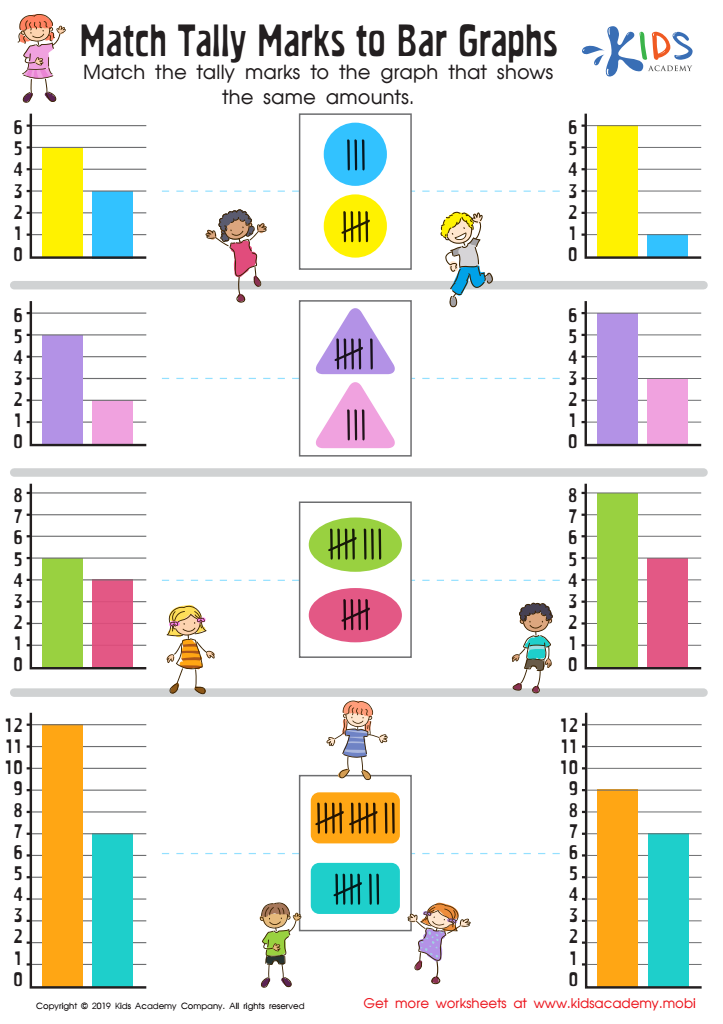

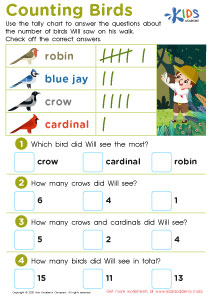
Match Tally Marks to Bar Graphs Worksheet
Parents and teachers should care about interpreting Extra Challenge Graphs for children ages 3-8 because these graphs provide valuable insights into a child's understanding of data and their analytical skills. At this young age, fostering skills in interpretation and critical thinking is crucial for their cognitive development. Engaging with graphs allows children to visualize information, recognize patterns, and make comparisons—all foundational skills for later math and science learning.
Furthermore, these graphs encourage dialogue between adults and children, promoting literacy in interpreting numerical information and enhancing vocabulary. They foster curiosity and a love for learning as children ask questions and explore what the data represents. For parents, understanding how their child interacts with graphs can provide a snapshot of their age-appropriate cognitive abilities and interests, enabling more tailored support in growing their skills.
Similarly, teachers using Extra Challenge Graphs can create more engaging lessons and help students apply their knowledge in meaningful ways. By prioritizing data interpretation from a young age, educators empower learners with essential skills that will benefit them academically, socially, and in future problem-solving scenarios. Overall, interpreting these data representations is vital for nurturing well-rounded, resourceful learners.
 Assign to My Students

