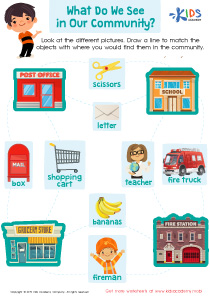
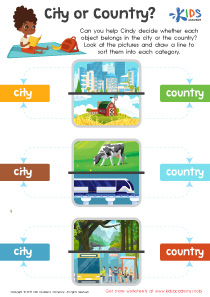
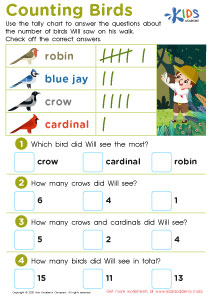
Interpreting data Extra Challenge Math Worksheets for Ages 5-8
3 filtered results
-
From - To
Unlock the world of data with our "Interpreting Data Extra Challenge Math Worksheets" for ages 5-8! Perfectly designed to boost early math skills, these engaging worksheets help young learners practice interpreting graphs, tables, and charts. Each activity is thoughtfully crafted to develop critical thinking and analytical skills in a fun and interactive way. With a range of challenging exercises, children can confidently make sense of data and enhance their problem-solving abilities. Our worksheets make learning meaningful and enjoyable, fostering a love for math from an early age. Perfect for classrooms and home learning, set the foundation for future math success today!
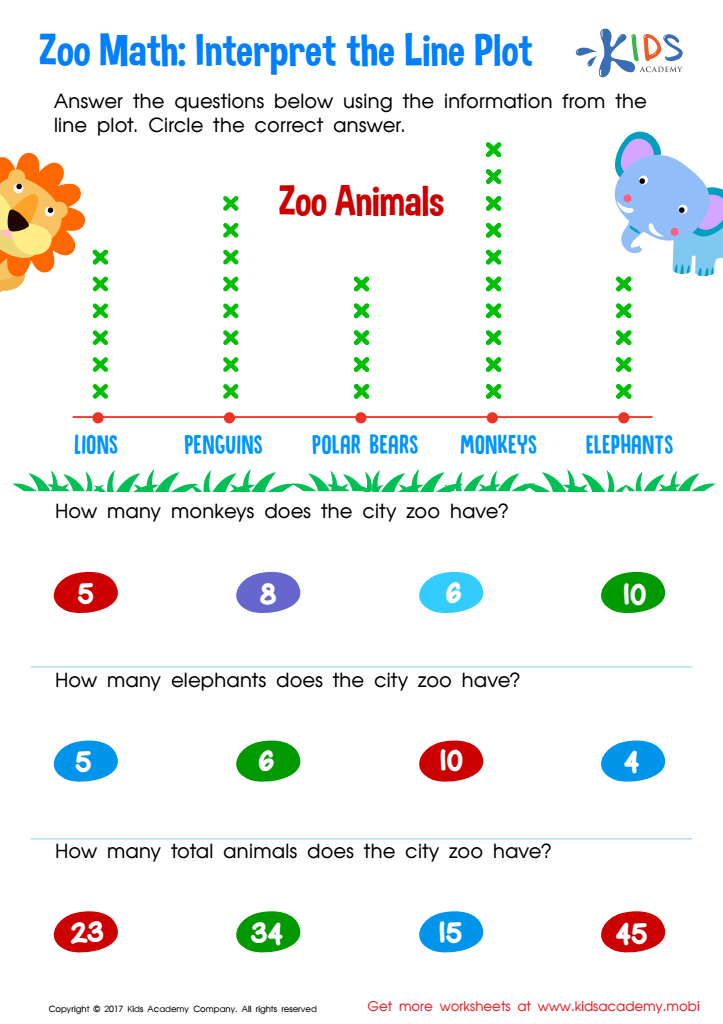

Interpret Line Plot Worksheet
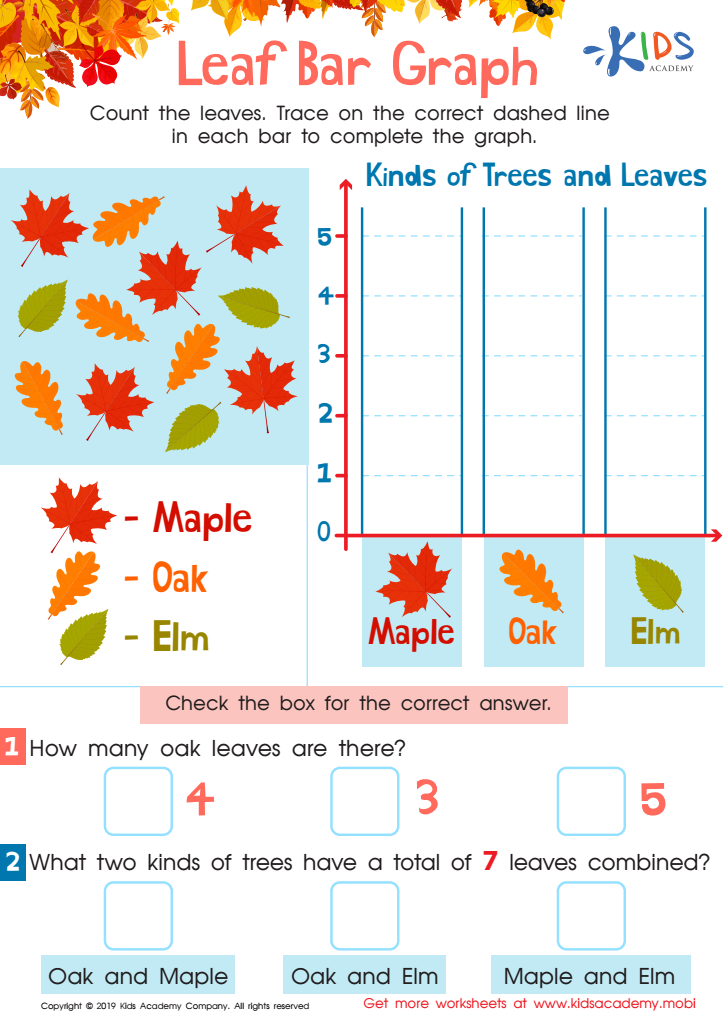

Leaf Bar Graph Worksheet
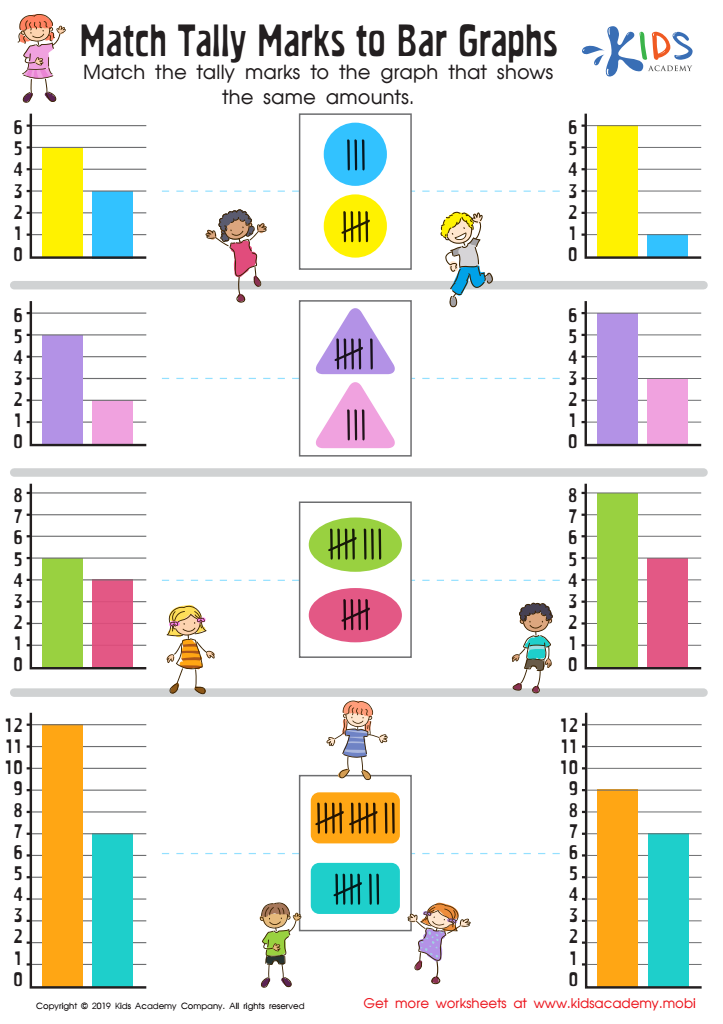

Match Tally Marks to Bar Graphs Worksheet
Interpreting data is a crucial skill that lays the foundation for logical thinking and problem-solving abilities in young children aged 5-8. For parents and teachers, focusing on extra challenge math activities offers several key benefits. First, it nurtures critical thinking and analytical skills. When children learn to interpret data through graphs, charts, and simple statistics, they develop the ability to discern patterns, draw conclusions, and make informed decisions.
Second, these activities foster a growth mindset. Challenging tasks encourage perseverance and resilience, helping children understand that effort and dedication lead to improvement. This attitude is essential not only for mathematics but for all areas of learning and life.
Third, early exposure to data interpretation can ignite an interest in STEM subjects. By making math engaging and showing its real-world applications, we can inspire a lasting enthusiasm for subjects that are often perceived as difficult or uninteresting.
Finally, interpreting data activities enhance overall academic performance. Skills acquired in math transfer across subjects, improving reading comprehension, writing clarity, and general cognitive abilities. Therefore, extra challenge math in data interpretation equips young learners with versatile intellectual tools, setting them on a path to academic success and informed citizenship. In essence, investing in these skills now can pave the way for a brighter future.
 Assign to My Students


.jpg)


