Data interpretation Extra Challenge Worksheets for Ages 5-9
4 filtered results
-
From - To
Elevate your child's analytical skills with our Data Interpretation Extra Challenge Worksheets designed for ages 5-9. Tailored to enhance math and critical thinking, these engaging worksheets help young learners interpret graphs, pie charts, and tables with ease. Perfect for kids who enjoy additional challenges in their learning journey, each worksheet fosters confidence in data analysis. From sorting and counting to comparing information, these fun activities make grasping complex concepts a breeze. Unleash their potential and watch them master important learning skills through boosted engagement. Download now to help your child excel in data interpretation!
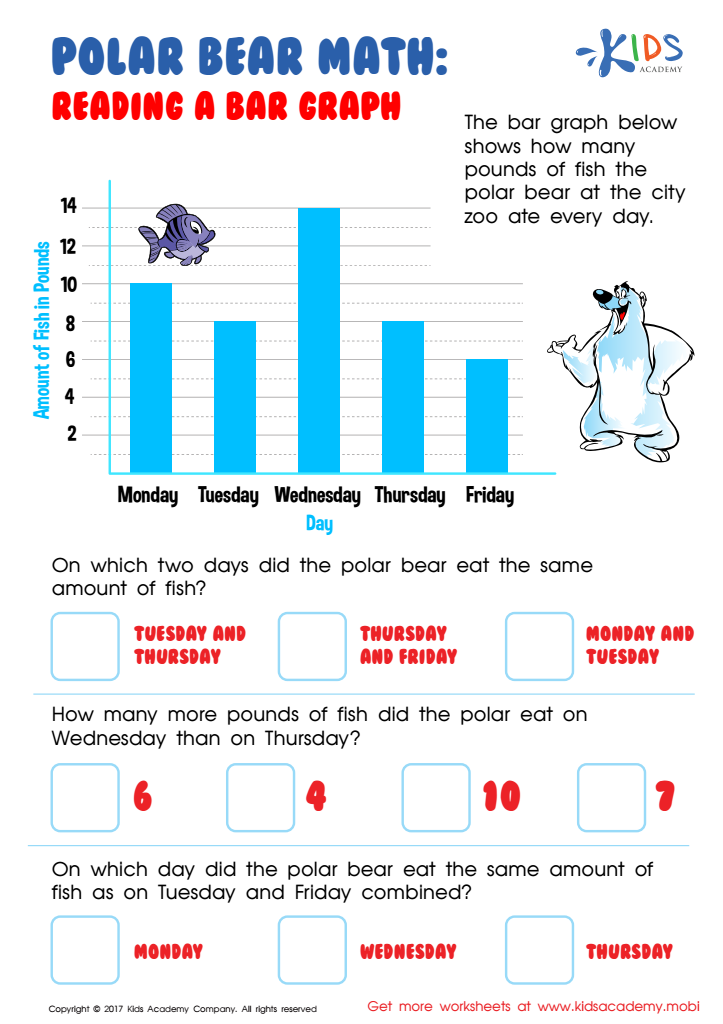

Reading Bar Graph Worksheet
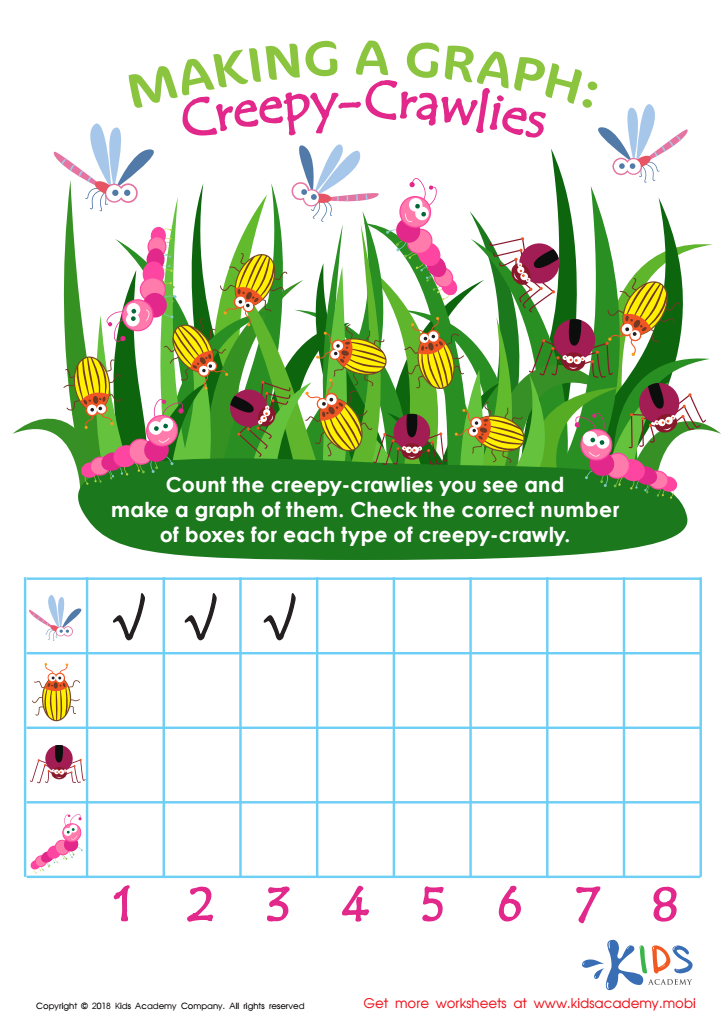

Making a Graph: Creepy Crawlies Worksheet
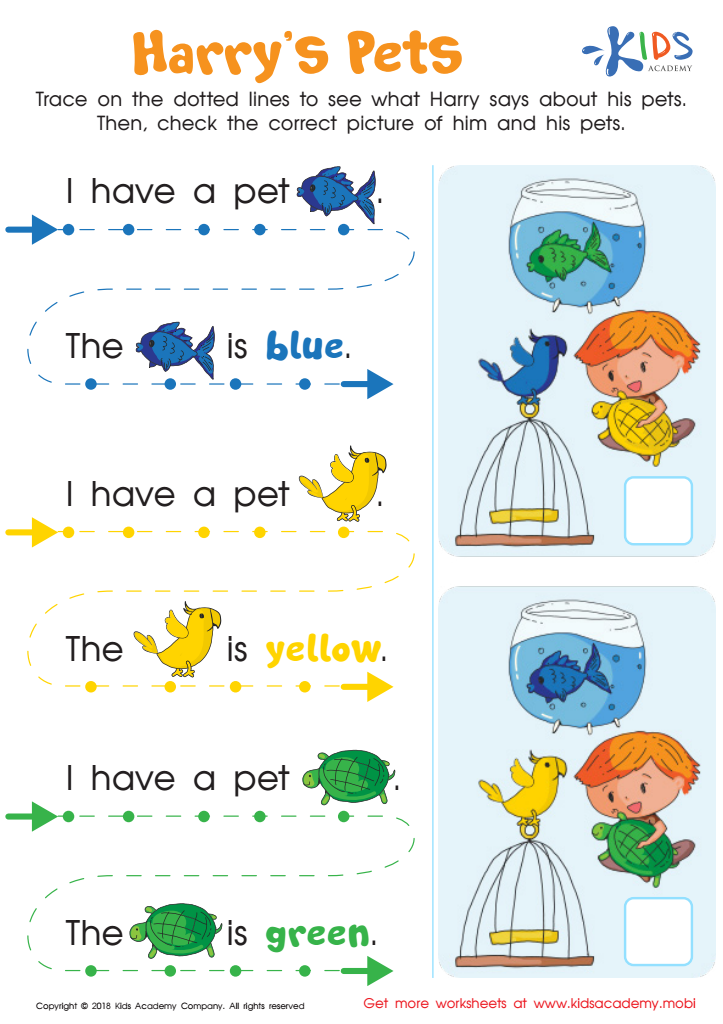

Read from Left to Right: Harry's Pets Worksheet
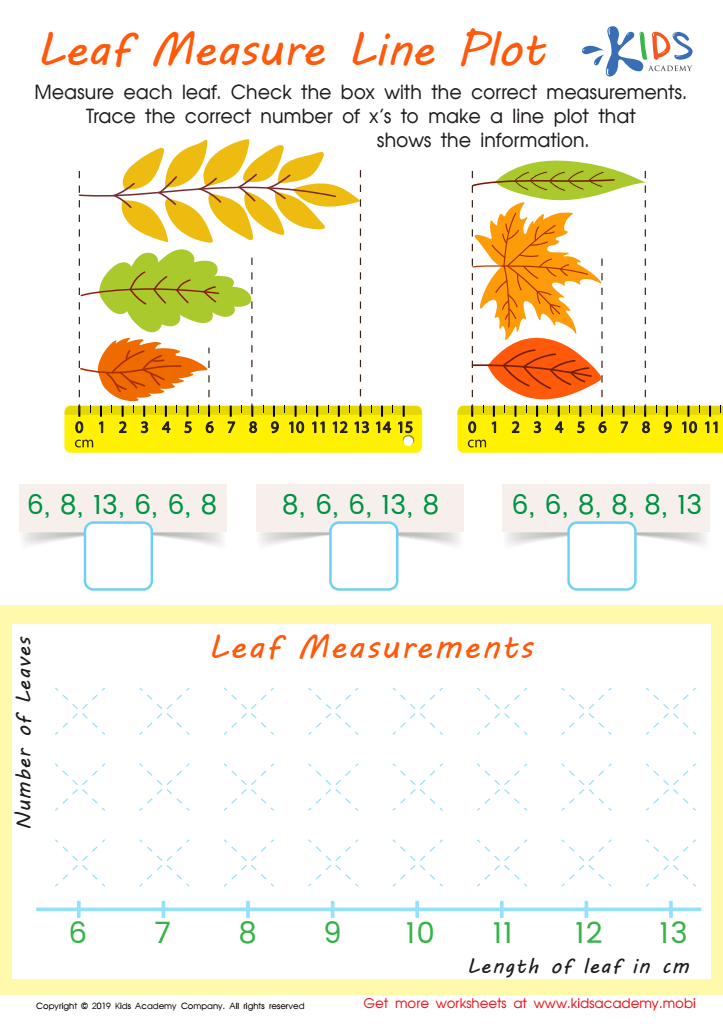

Leaf Measure Line Plot Worksheet
Introducing Data Interpretation Extra Challenges to young learners, ages 5-9, holds significant developmental benefits for their holistic growth. At this formative stage, children are naturally curious and open to new learning experiences. Engaging them with data interpretation exercises nurtures critical thinking skills early on. It encourages them to observe, analyze, and draw conclusions from various forms of data such as graphs, charts, or simple sets of information.
Moreover, data interpretation challenges often involve problem-solving, which is crucial for cognitive development. They foster logical thinking and give young students the tools to approach problems methodically—a foundational skill not just in math or science, but across all disciplines. By interpreting data, children simultaneously enhance their numeracy and literacy skills, as they need to comprehend what the data represents and sometimes articulate their findings.
Equally important is the aspect of fostering a growth mindset. When children tackle data challenges and see the fruits of their efforts, it builds confidence and resilience. They learn the value of persistence and the joy of discovery. This sense of achievement and capability paves the way for lifelong learning. Therefore, incorporating data interpretation into early education sets the stage for both academic success and essential life skills.
 Assign to My Students


