Data interpretation Extra Challenge Worksheets for Ages 7-9
3 filtered results
-
From - To
Our Data Interpretation Extra Challenge Worksheets for Ages 7-9 are designed to elevate your child's analytical skills. Packed with fun and engaging activities, these worksheets help young learners master the art of decoding charts, graphs, and tables. Perfect for kids who love a challenge, each sheet strengthens critical thinking and problem-solving abilities, preparing them for more complex concepts. With a diverse range of exercises, these printables make learning enjoyable and effective. Visit us at Kids Academy to boost your child’s data interpretation skills in an interactive and encouraging environment!
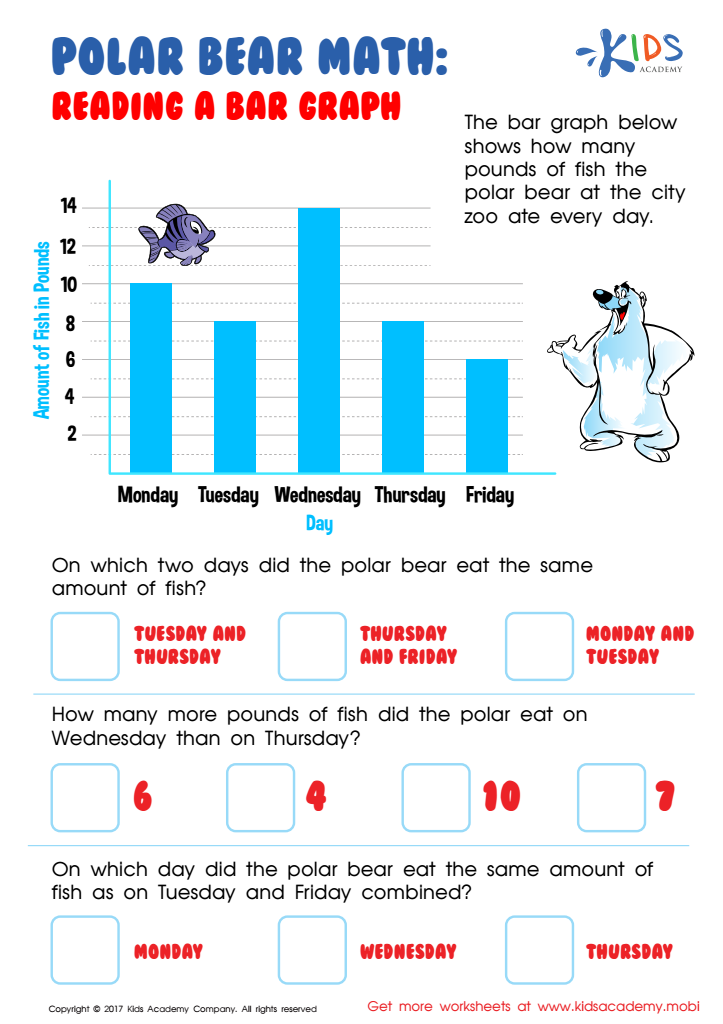

Reading Bar Graph Worksheet
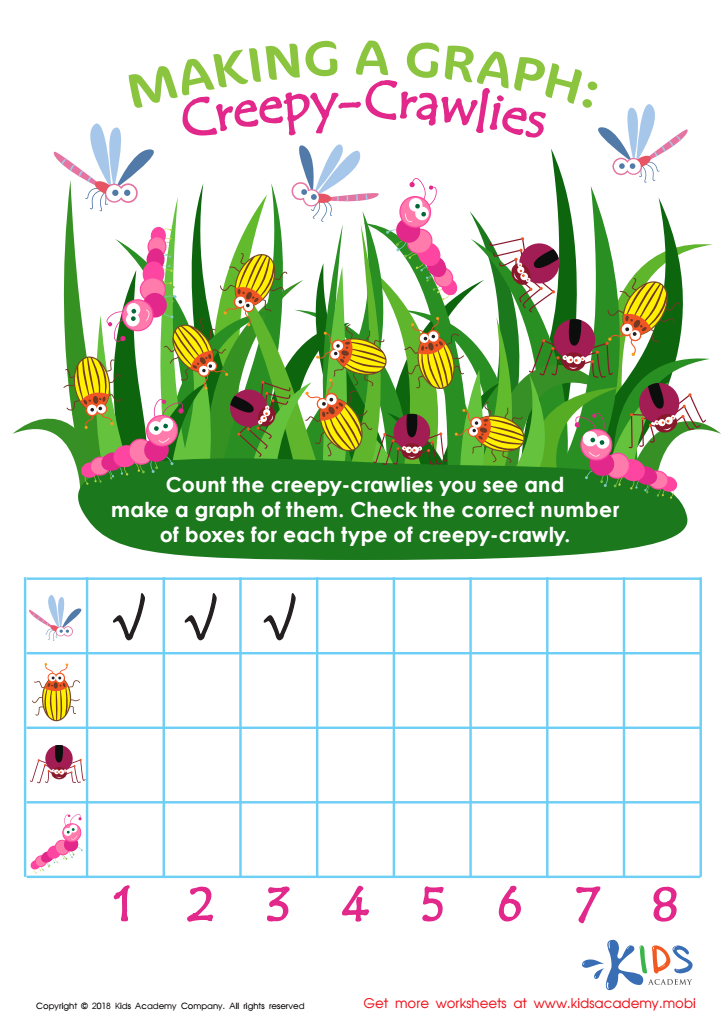

Making a Graph: Creepy Crawlies Worksheet
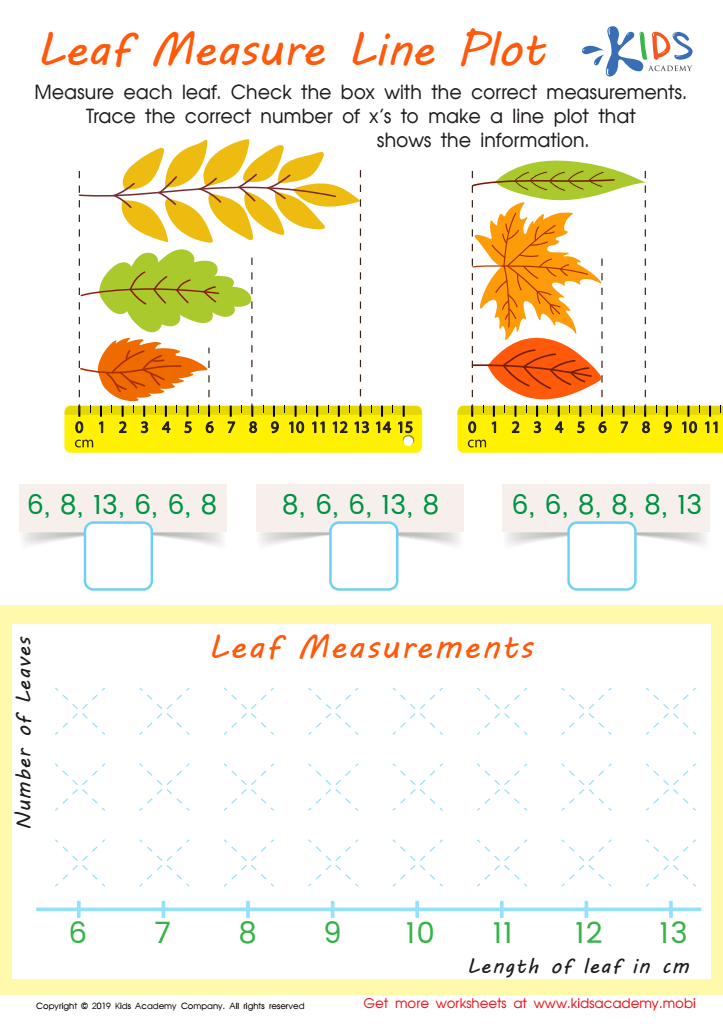

Leaf Measure Line Plot Worksheet
Caring about data interpretation challenges for children ages 7-9 is crucial for both parents and teachers because these activities lay a robust foundation for critical thinking, problem-solving, and analytical skills in young students. During these formative years, children's brains are highly adaptable, making it an ideal time to introduce concepts that enhance their cognitive development.
Data interpretation encourages students to understand and make sense of information presented in various forms, such as charts, graphs, and tables. Engaging with these challenges helps children develop numerical literacy and the ability to spot patterns, recognize trends, and make data-driven decisions, skills that are invaluable across all academic disciplines and in everyday life.
In addition to fostering intellectual growth, data interpretation exercises also bolster essential life skills such as perseverance, attention to detail, and logical reasoning. These activities promote curiosity and intrinsic motivation by showing students that data and numbers can tell compelling stories and solve real-world problems.
Moreover, in an increasingly data-driven world, early familiarity with data not only enhances academic performance but also better prepares children for future technological and analytical demands. Thus, both parents and teachers should prioritize data interpretation challenges to support well-rounded, capable individuals in an evolving digital society.
 Assign to My Students


