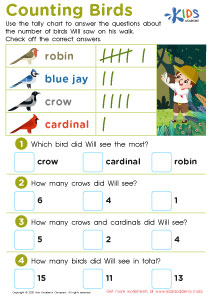
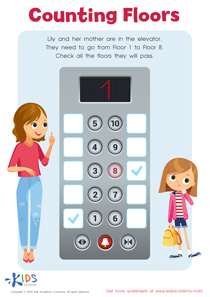
Interpreting data Extra Challenge Graphs Worksheets
3 filtered results
-
From - To
Unlock the power of data analysis with our "Interpreting Data Extra Challenge Graphs Worksheets." Designed for early grade students, these worksheets offer engaging, hands-on activities that challenge learners to read and interpret various graphs effectively. With an array of activities, including analyzing bar graphs, line charts, and pictographs, students will enhance their critical thinking and analytical skills while having fun. Each worksheet is crafted to promote deeper understanding and mastery of concepts related to data interpretation. Perfect for classroom use or at-home practice, these extra challenge worksheets empower young mathematicians to tackle graphs with confidence! Explore these printable resources today!
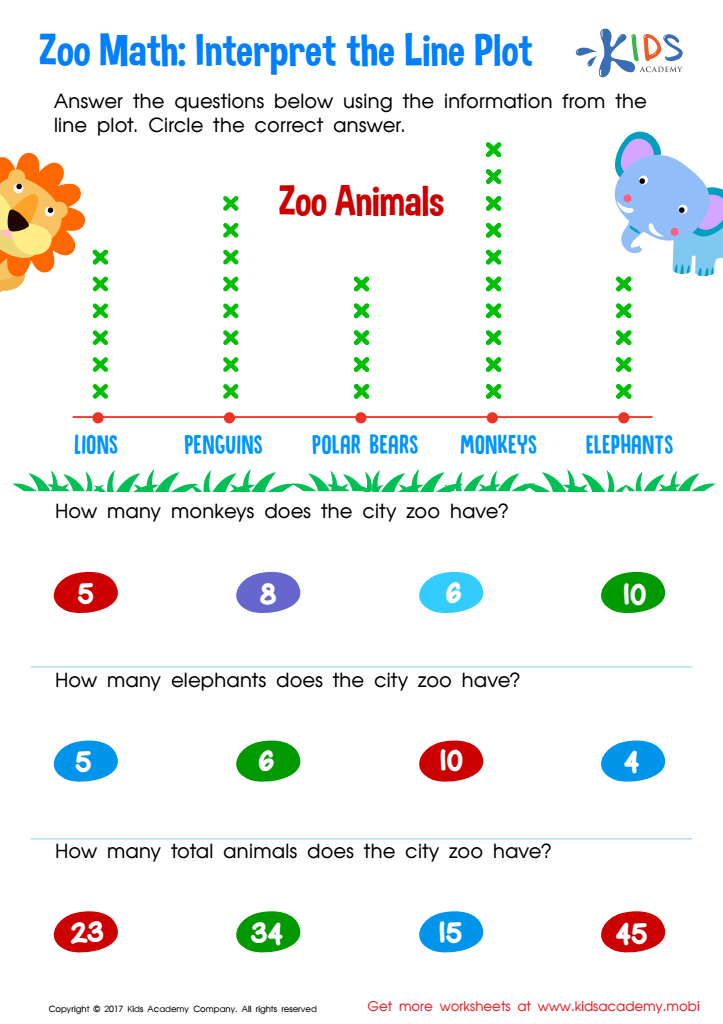

Interpret Line Plot Worksheet
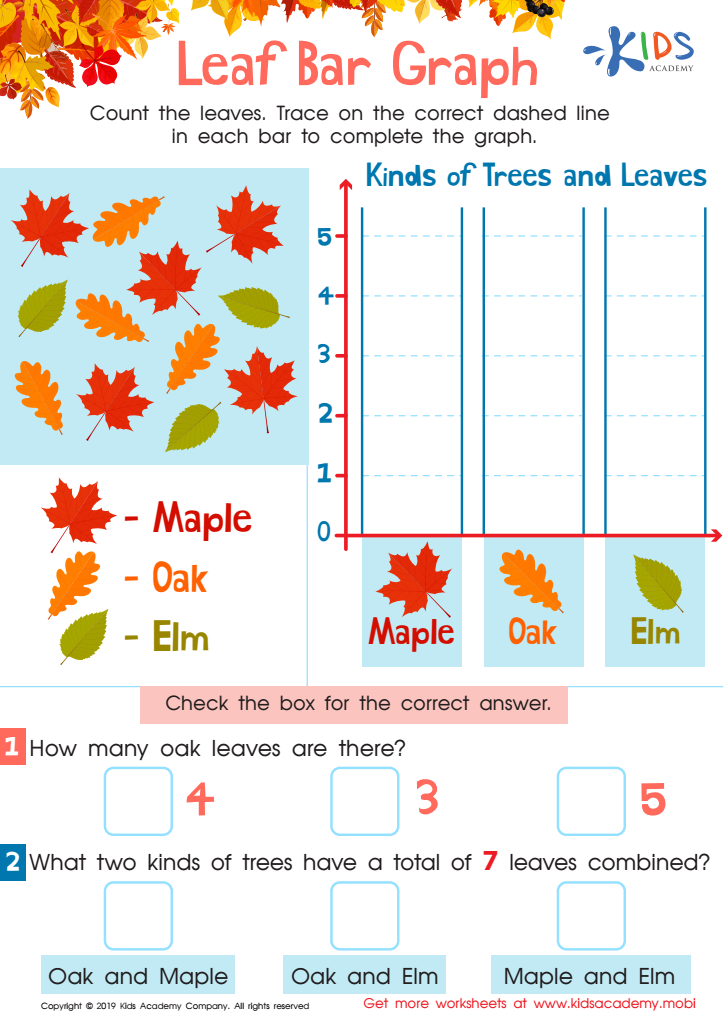

Leaf Bar Graph Worksheet
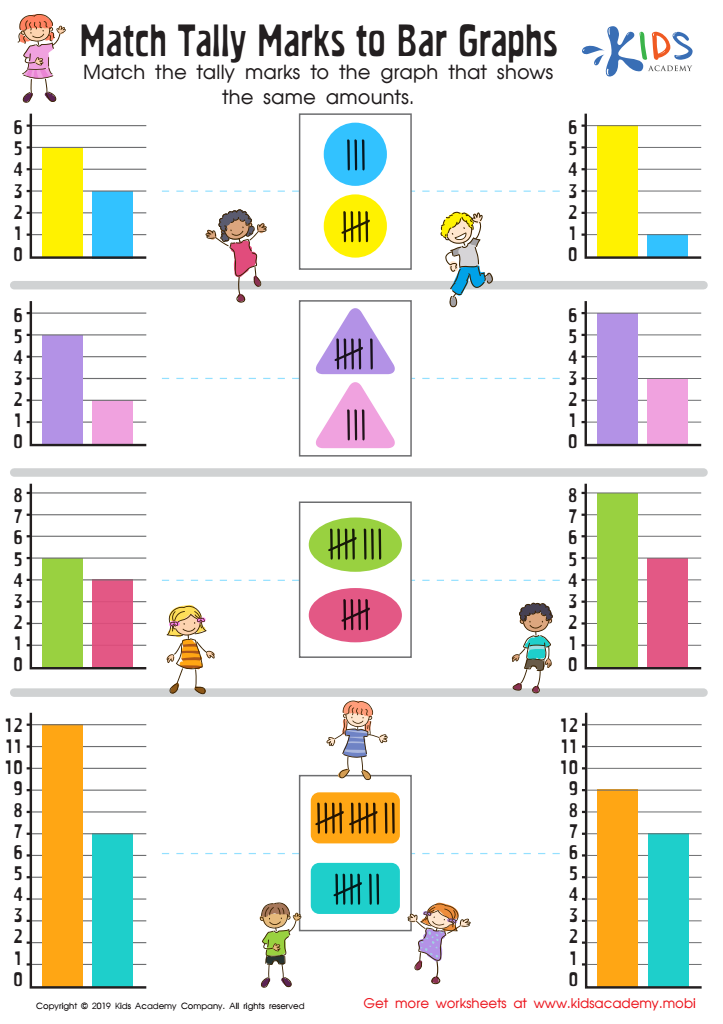

Match Tally Marks to Bar Graphs Worksheet
Interpreting data, especially through tools like Extra Challenge Graphs, is crucial for parents and teachers who strive to enhance students' educational experiences. These graphs provide visual representations of a child's progress in various subjects, illustrating patterns that may not be easily visible in raw numbers. Understanding these graphs enables educators to identify areas where a student excels or struggles, facilitating targeted interventions and personalized learning strategies to foster improvement.
Moreover, parents can use this data to actively engage with their child's learning journey. By interpreting the graphs, they can have informed discussions with teachers, ask relevant questions about curriculum pace, and better support academic interests at home.
In classrooms, teachers can evaluate the effectiveness of different teaching methods by analyzing collective data trends, helping them refine their instructional approaches to meet diverse learning needs.
Ultimately, by caring about data interpretation, parents and teachers together create a partnership that builds a stronger foundation for students' academic success, encourages reflective practices, and promotes a growth mindset—helping children not only to achieve educational milestones but also to develop critical thinking and analytical skills essential for lifelong learning. Recycling these insights into instructional decisions makes a tangible difference in students’ lives.
 Assign to My Students


