Analyzing data Graphs Worksheets
5 filtered results
-
From - To
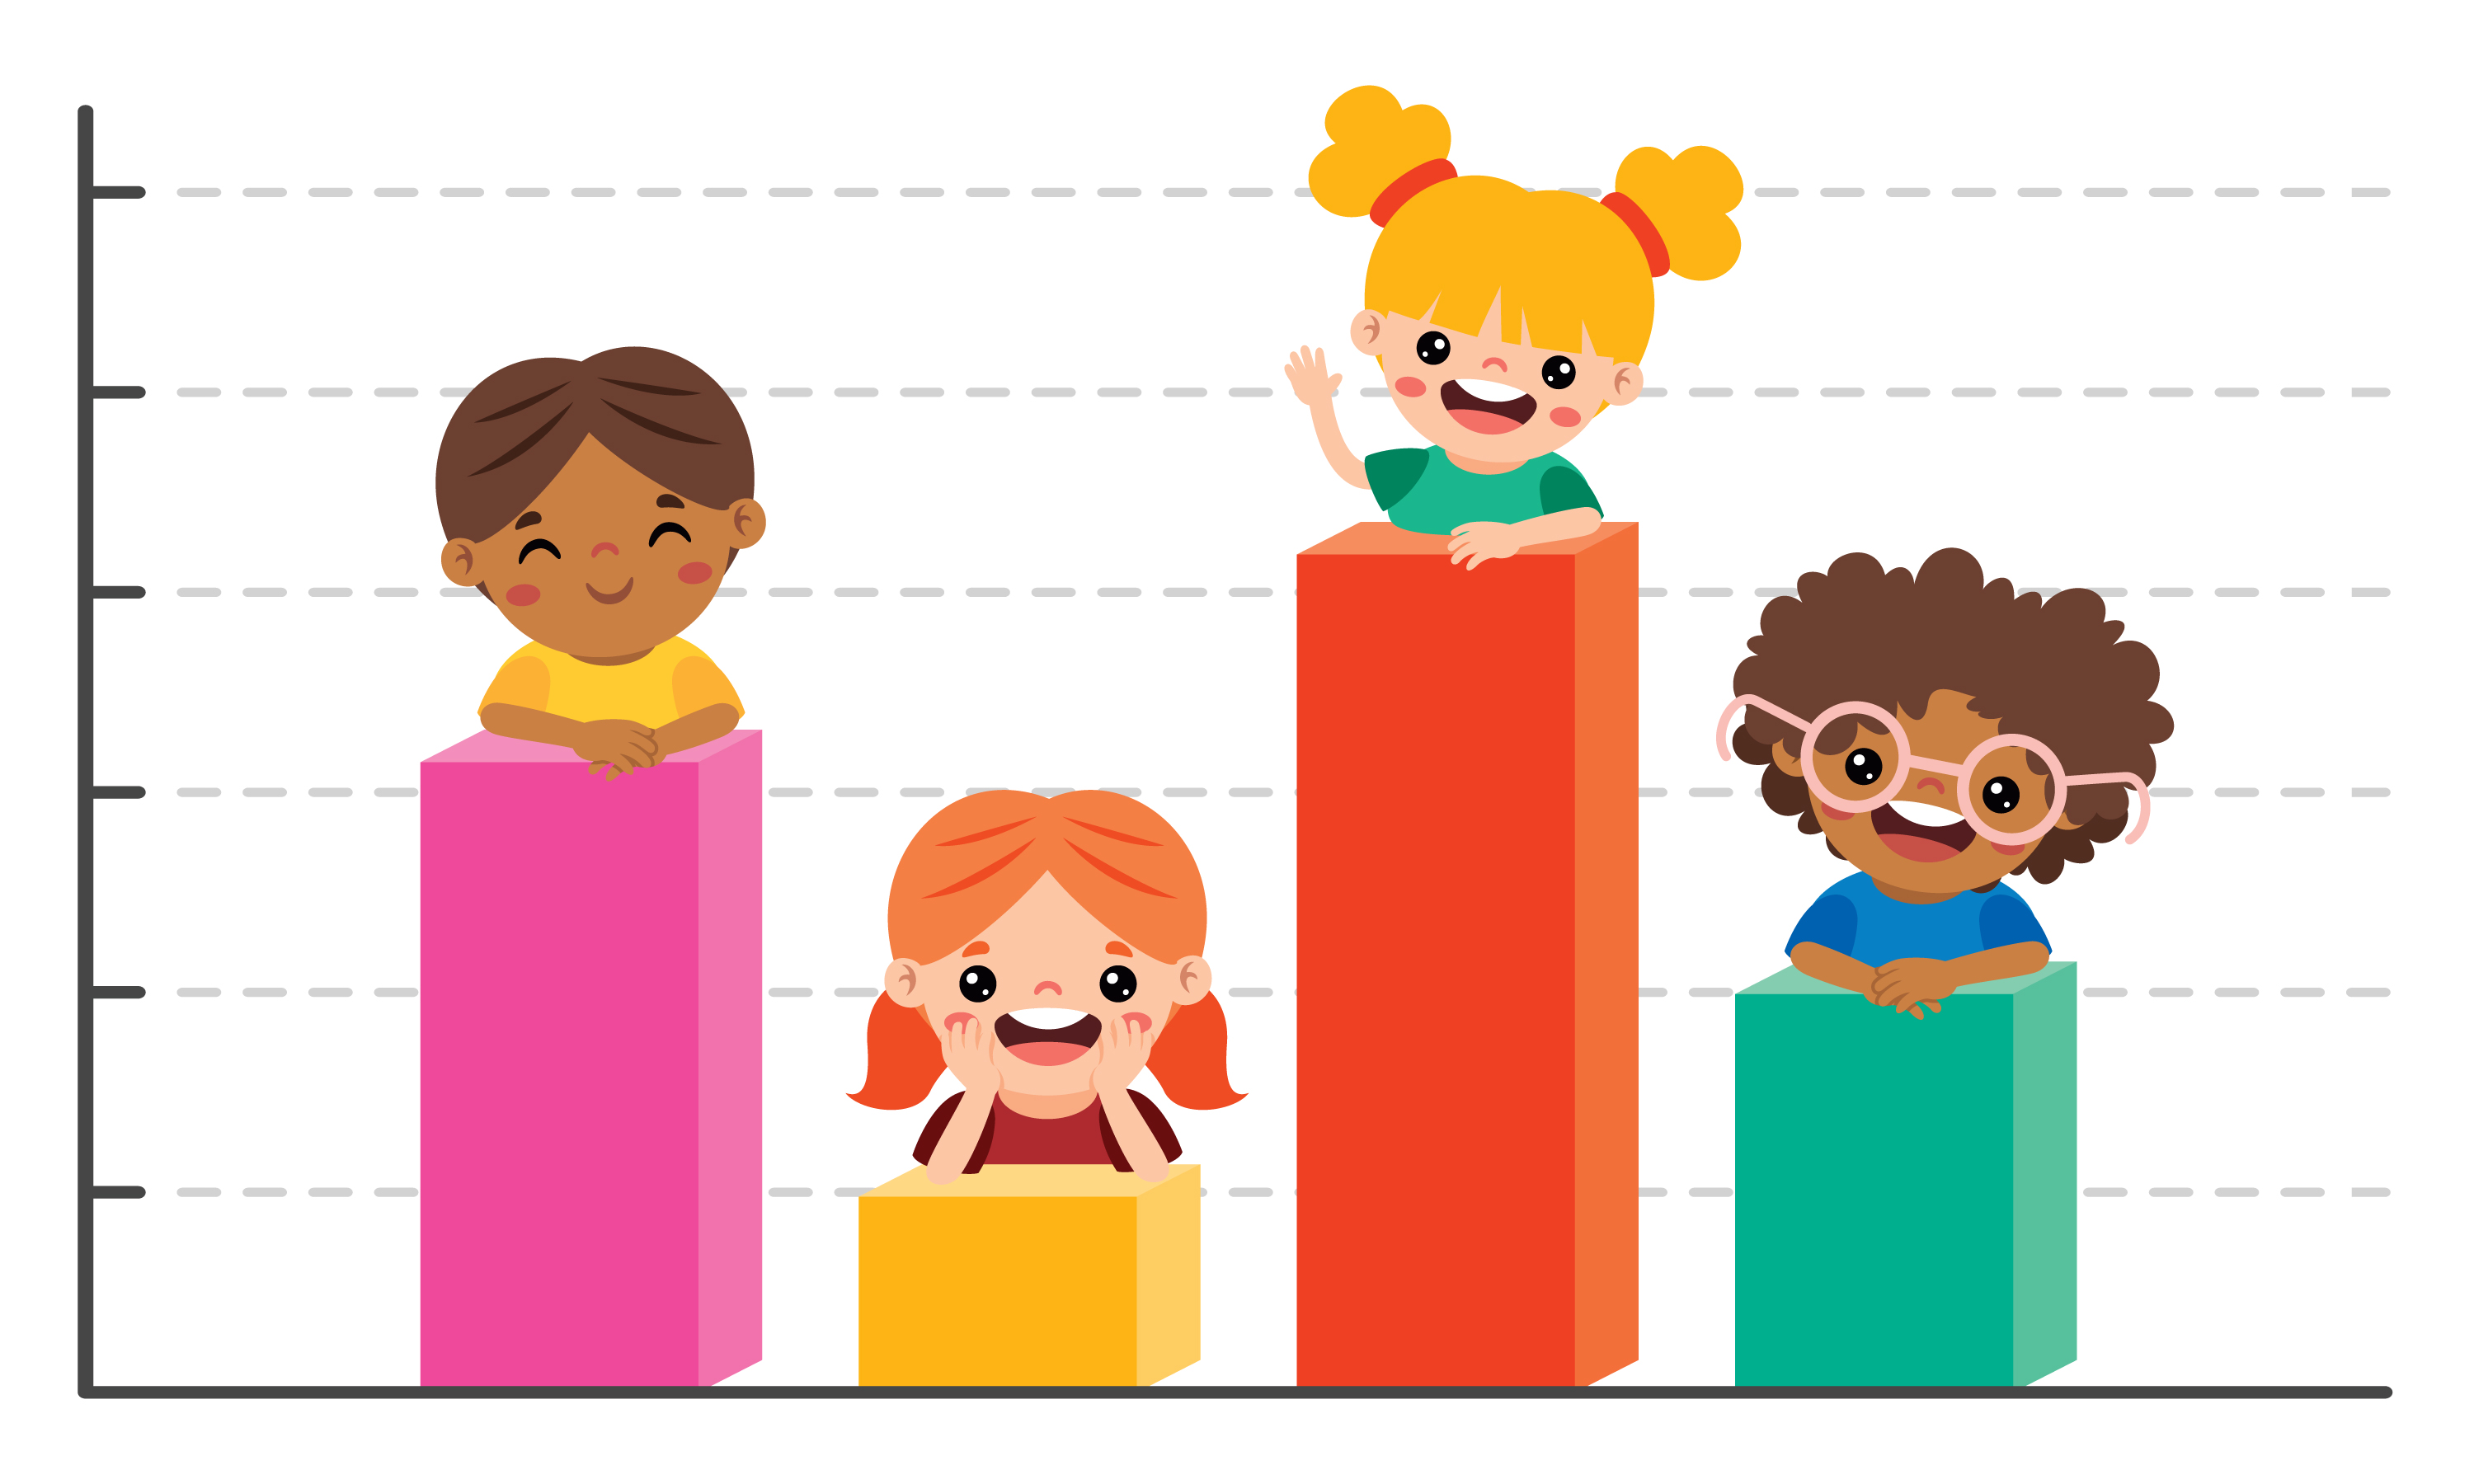
Discover our "Analyzing Data Graphs Worksheets," designed to enhance your child’s skills in interpreting and understanding graphical data. Our expertly crafted worksheets provide engaging exercises that help young learners read bar graphs, pie charts, and line plots. Perfect for early grade students, these tools foster critical thinking and analytical abilities. Each worksheet incorporates fun, relatable themes, and step-by-step instructions to ensure kids effortlessly grasp concepts and boost their proficiency in math. Ideal for classroom or home use, our resources support comprehensive learning and a deeper appreciation of data analysis in real-world contexts. Empower your child with essential graph-reading skills today!
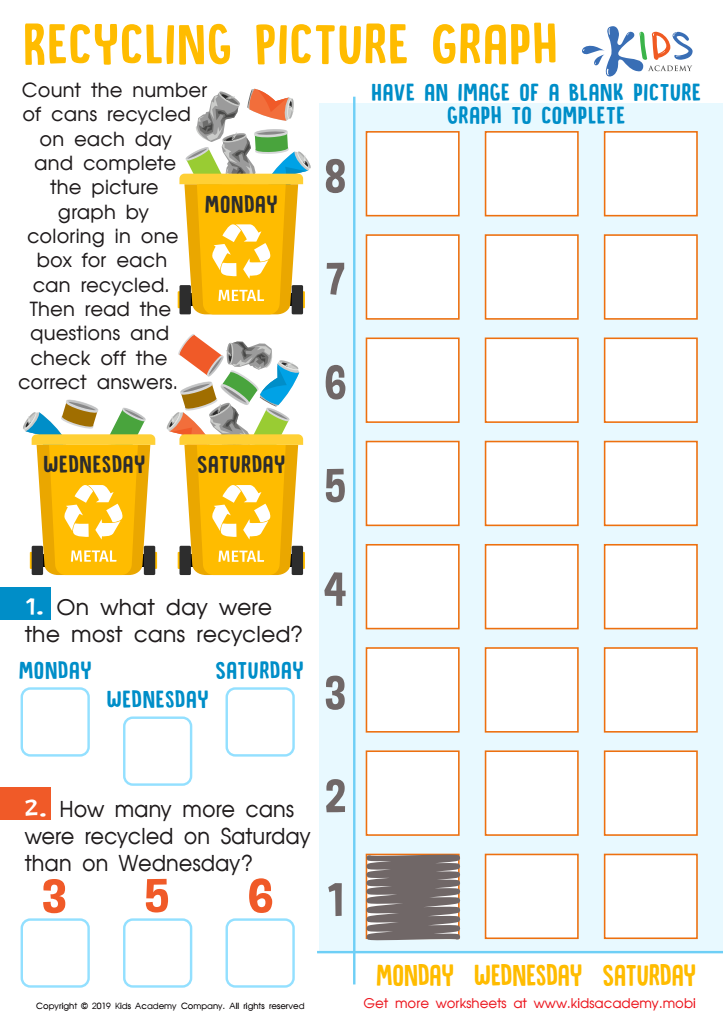

Recycling Picture Graph Worksheet
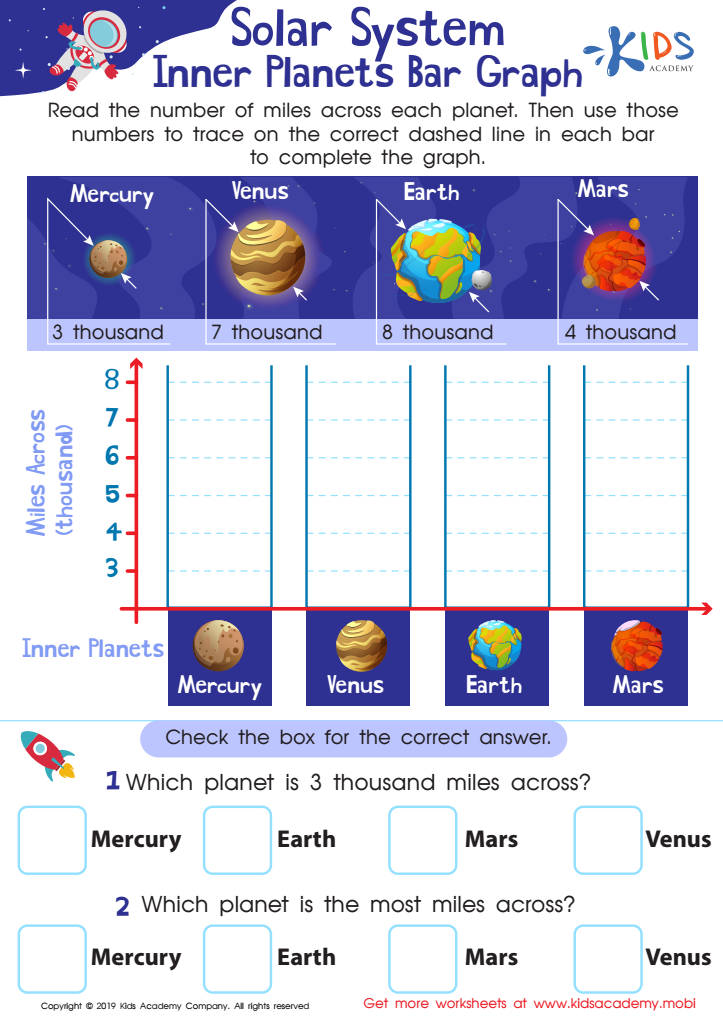

Planets Bar Graph Worksheet
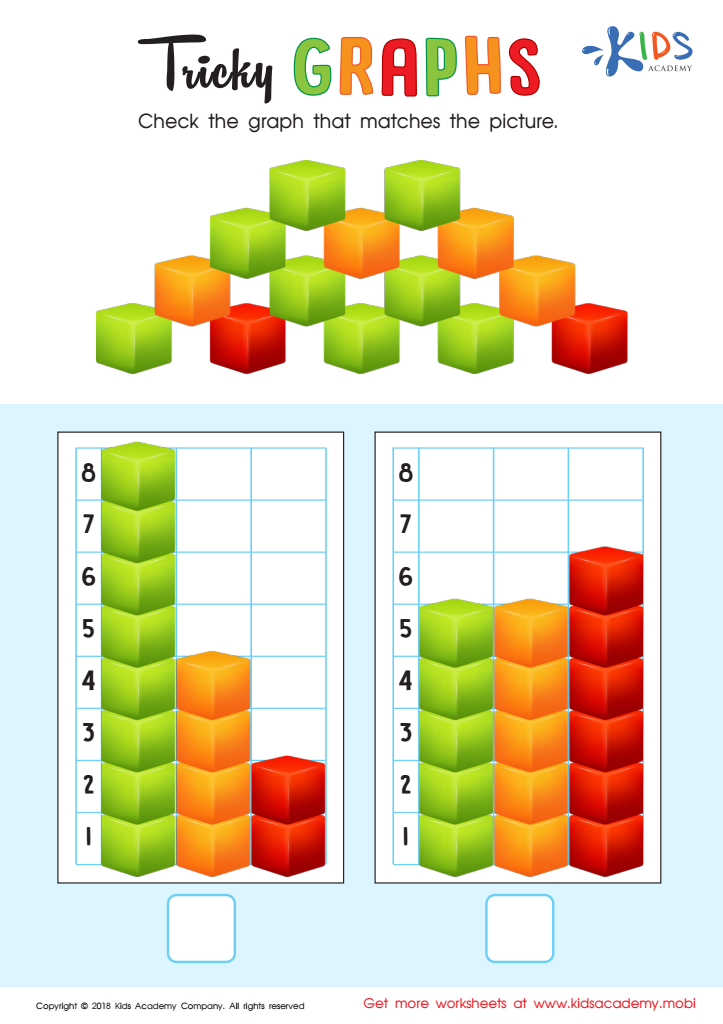

Tricky Graphs Worksheet
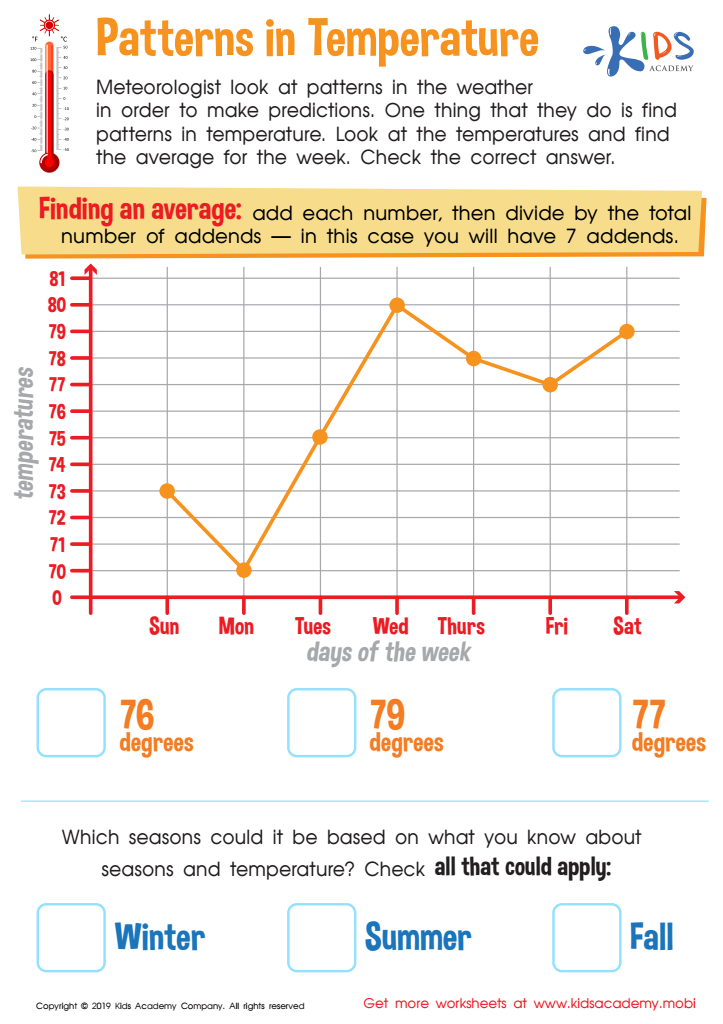

Patterns in Temperature Worksheet
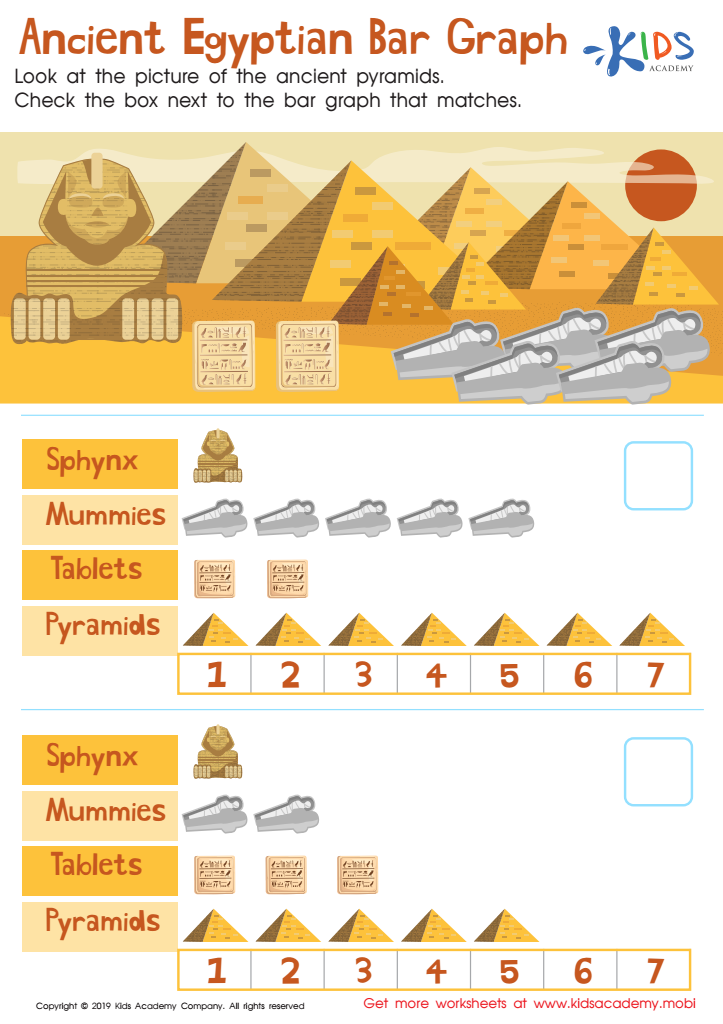

Egyptian Bar Graph Worksheet
Analyzing data graphs is important for both parents and teachers as it provides a visual representation of information, making it easier to comprehend and interpret. For teachers, data graphs can illustrate students' progress over time, highlight trends in performance, and pinpoint areas that need improvement. This allows teachers to tailor their teaching strategies to meet the specific needs of their students, facilitating a more individualized and effective learning experience. For example, a line graph that shows reading proficiency levels could help a teacher identify which students might benefit from additional support or enrichment activities.
Parents also benefit from understanding data graphs, as these visual tools offer a clear snapshot of their child's academic achievements and growth within the classroom context. This enables parents to make informed decisions about how to assist their child's learning at home and engage more constructively during parent-teacher conferences. For instance, if a bar graph indicates that a child's math skills are below grade level, parents can provide additional practice or explore external resources to support their child.
Overall, by analyzing data graphs, both parents and teachers gain valuable insights into educational outcomes, thereby fostering a collaborative environment focused on enhancing student success and addressing challenges proactively.
 Assign to My Students
