Counting skills Measurement Worksheets for Ages 3-9
8 filtered results
Difficulty Level
Grade
Age
-
From - To
Subject
Activity
Standards
Interactive
Favorites
With answer key
Interactive
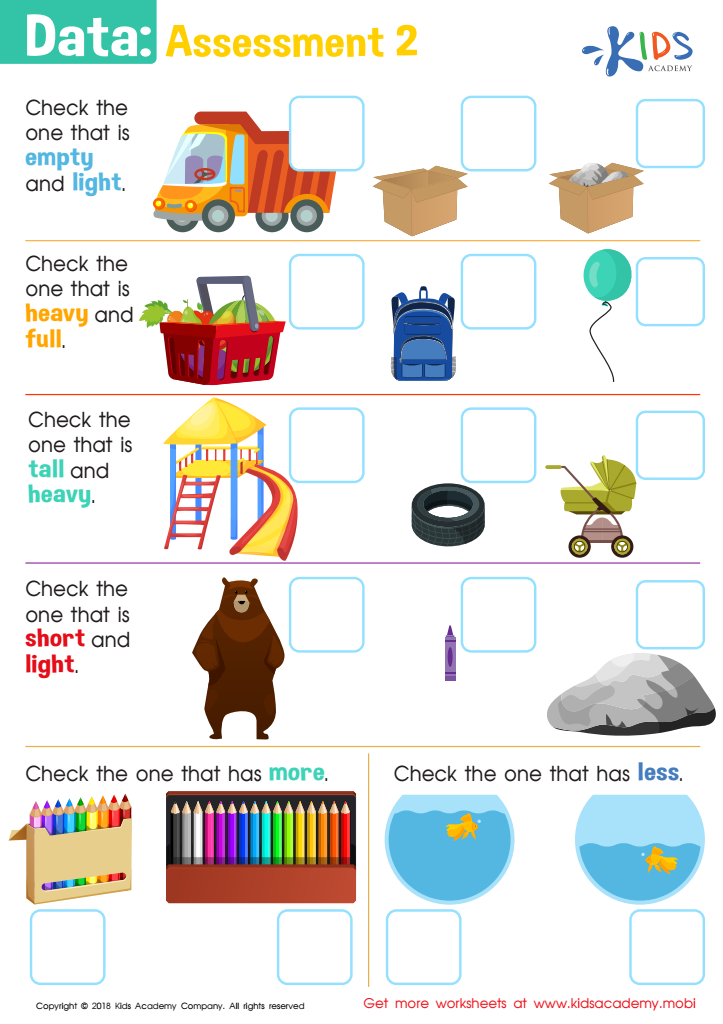

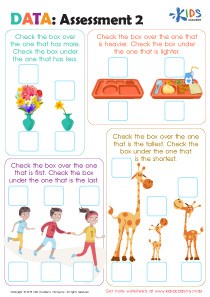
Data: Assessment 2 Worksheet
This PDF helps you assess your students' understanding of concepts like empty/light, full/heavy, tall/short, and more/less. With this worksheet, students use pictures to answer questions and check off the appropriate box. It's a fast, easy way to determine what concepts they have learned and which need more work.
Data: Assessment 2 Worksheet
Worksheet
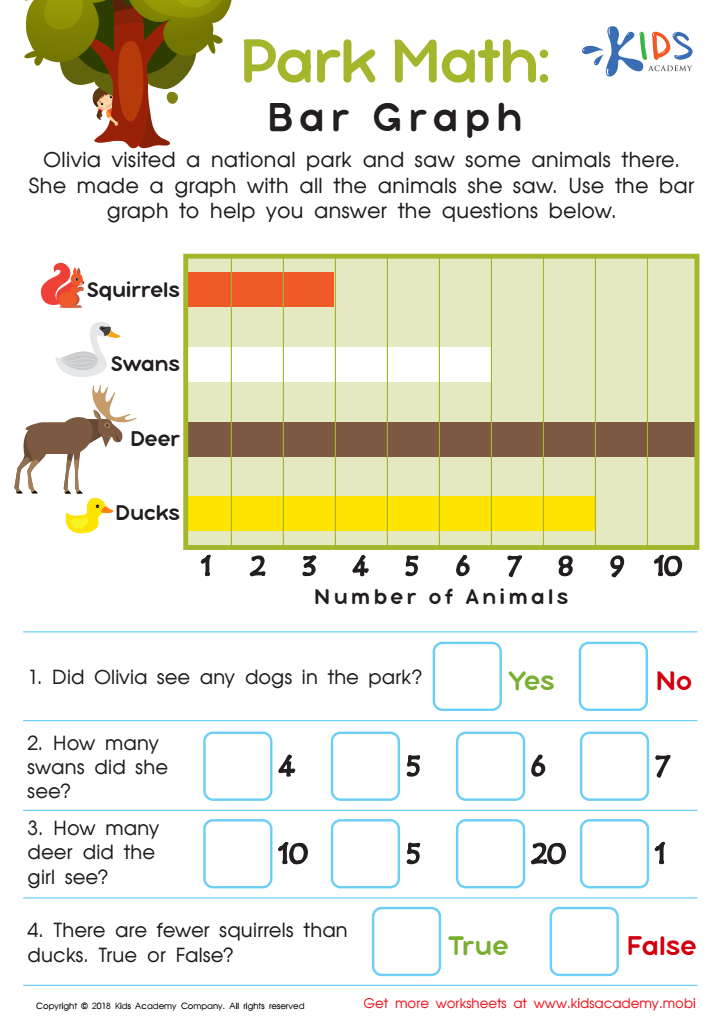

Park Math: Bar Graph Worksheet
Do your children love the park? Ask them to tell you some of their favorite animals. Then, have them look at Olivia's graph. She visited a National Park and recorded all the animals she saw. Use the graph to answer the questions given.
Park Math: Bar Graph Worksheet
Worksheet
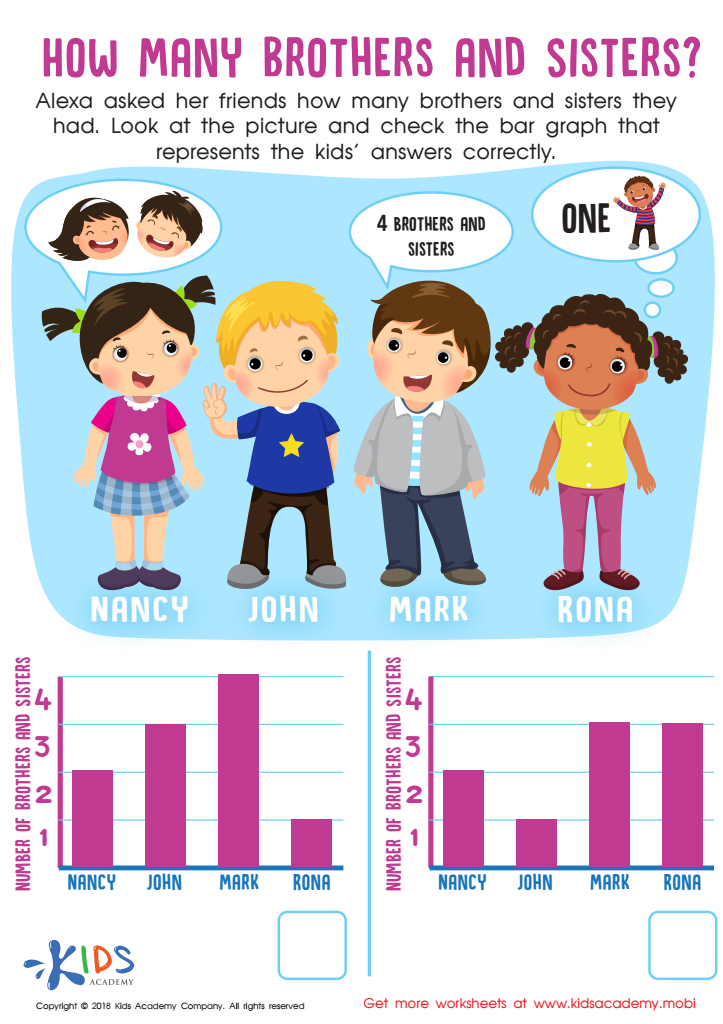

How Many Brothers and Sisters? Worksheet
With this worksheet, Alexa has asked her friends how many siblings they have. Have your child look at the picture and use it to answer the bar graph correctly. Can they tell you how many siblings their friends have? See if they can get it right!
How Many Brothers and Sisters? Worksheet
Worksheet
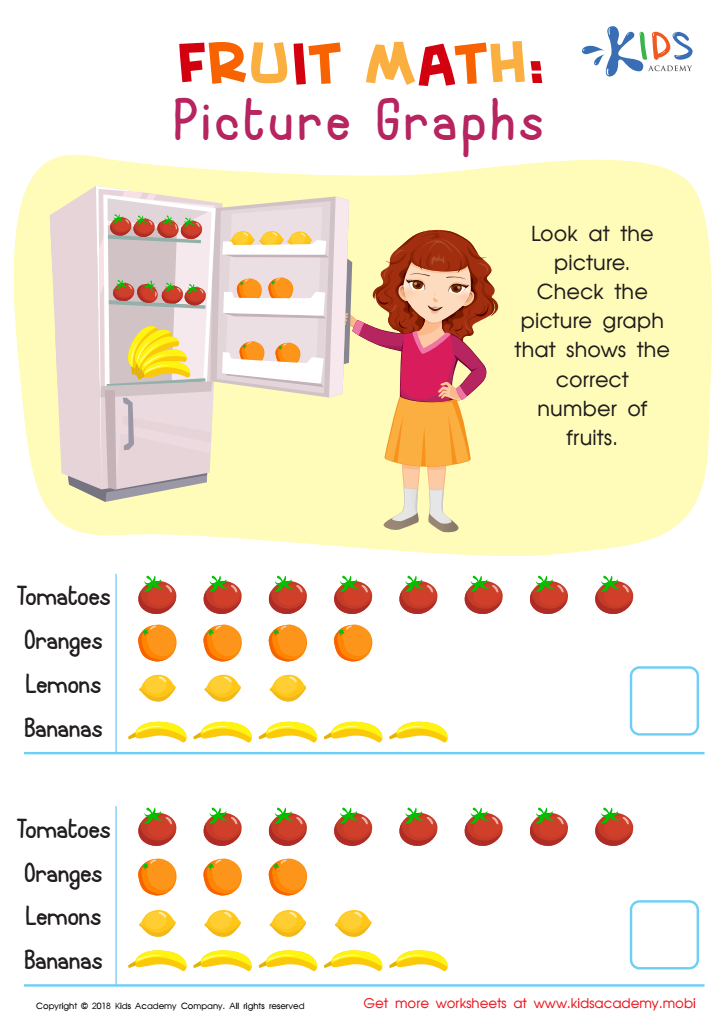

Fruit Math: Picture Graphs Worksheet
Help your child learn to draw graphs by having them look at pictures. Ask them to identify a graph that accurately portrays the data and have them explain why. This will prepare them to easily draw more complex graphs in the future. For example, have them look at the picture with the number of fruits in the colorful worksheet and explain why the graph is accurate.
Fruit Math: Picture Graphs Worksheet
Worksheet
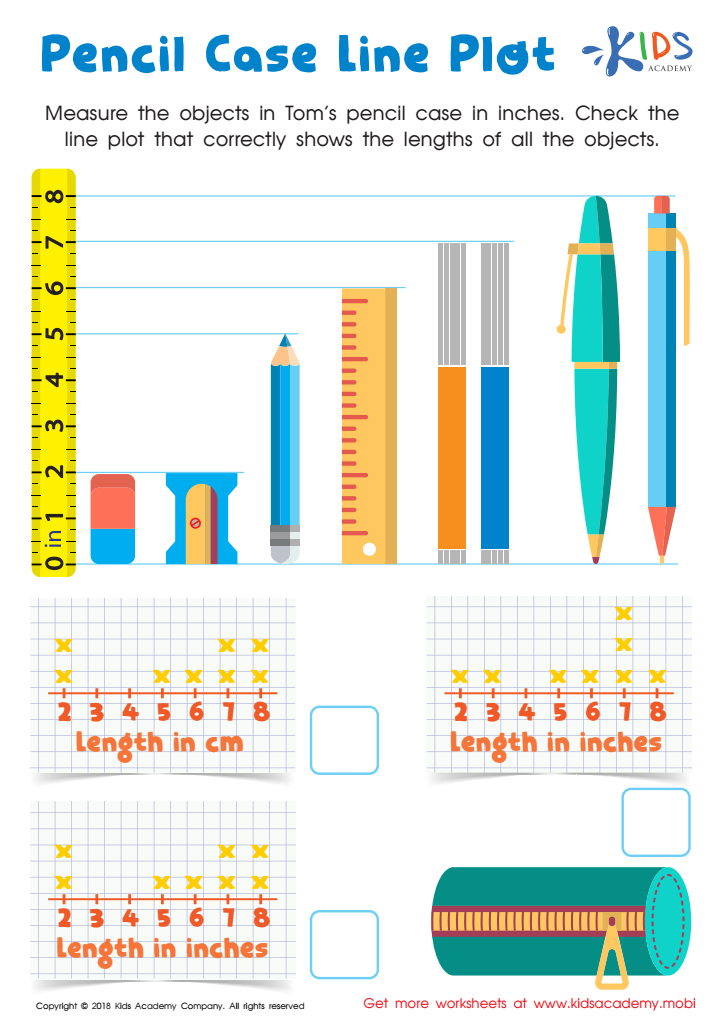

Pencil Case Line Plot Worksheet
Explain to your child that a line plot is a way to organize information. For example, if they need to arrange objects, they should draw a line plot. Now, have them help Tom measure the objects in his pencil case in inches. Then, have them check the line plot that accurately shows the length.
Pencil Case Line Plot Worksheet
Worksheet
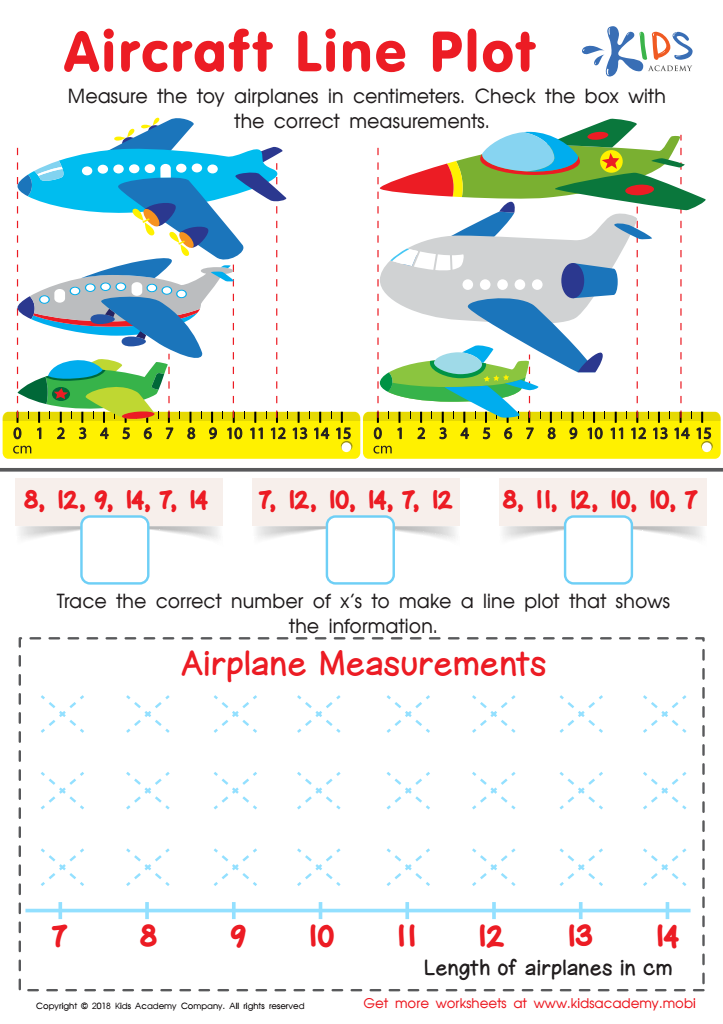

Aircraft Line Plot Worksheet
If your kids are aviation enthusiasts, they'll love this worksheet! Look at the picture with them, then ask them to measure the toy planes in cm. Check the box with the right measurements and then trace the x's to make a line plot with the data.
Aircraft Line Plot Worksheet
Worksheet
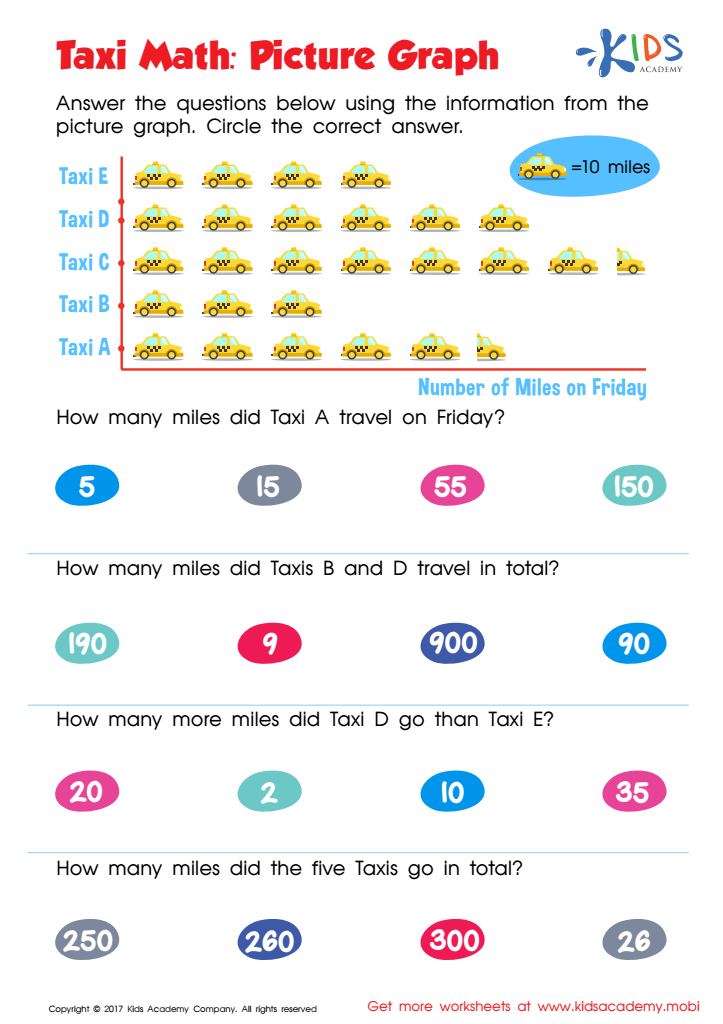

Taxi Math Worksheet
This 3rd grade worksheet helps kids learn data viz with fun taxis and colors to make the graph come alive. Picture graphs are an engaging way to teach data analysis, and this worksheet is the perfect tool!
Kids love picture graphs! This 3rd grade worksheet uses colorful taxis to help them learn to read graphs better. Each image represents a number, teaching data analysis with visuals and fun. An engaging way to learn data viz, this worksheet is perfect for young learners.
Taxi Math Worksheet
Worksheet
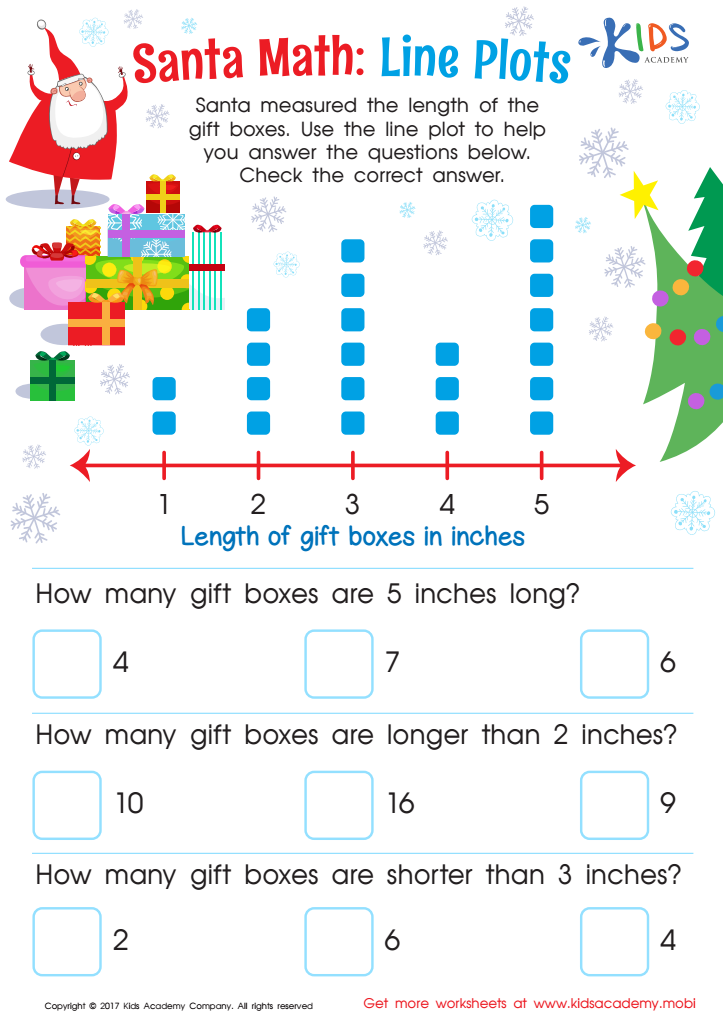

Line Plot Worksheet
Help your child measure presents with Santa using this 2nd grade line plot worksheet! It's a fun way to boost math skills and analyze data. Plus, it's sure to delight your child!
Line Plot Worksheet
Worksheet
 Assign to My Students
