Interpreting data Grade 3 Worksheets
3 filtered results
-
From - To
Enhance your third grader's analytical skills with our "Interpreting Data Grade 3 Worksheets." Designed for young learners, these worksheets offer engaging activities that teach students how to analyze and interpret various types of data, including charts, graphs, and tables. Each worksheet aligns with key learning objectives, helping kids to grasp important concepts while having fun. Perfect for classroom use or at-home practice, these printables are excellent resources to support your child's education journey. Foster critical thinking and problem-solving skills today with our comprehensive collection tailored to make learning an exciting adventure!
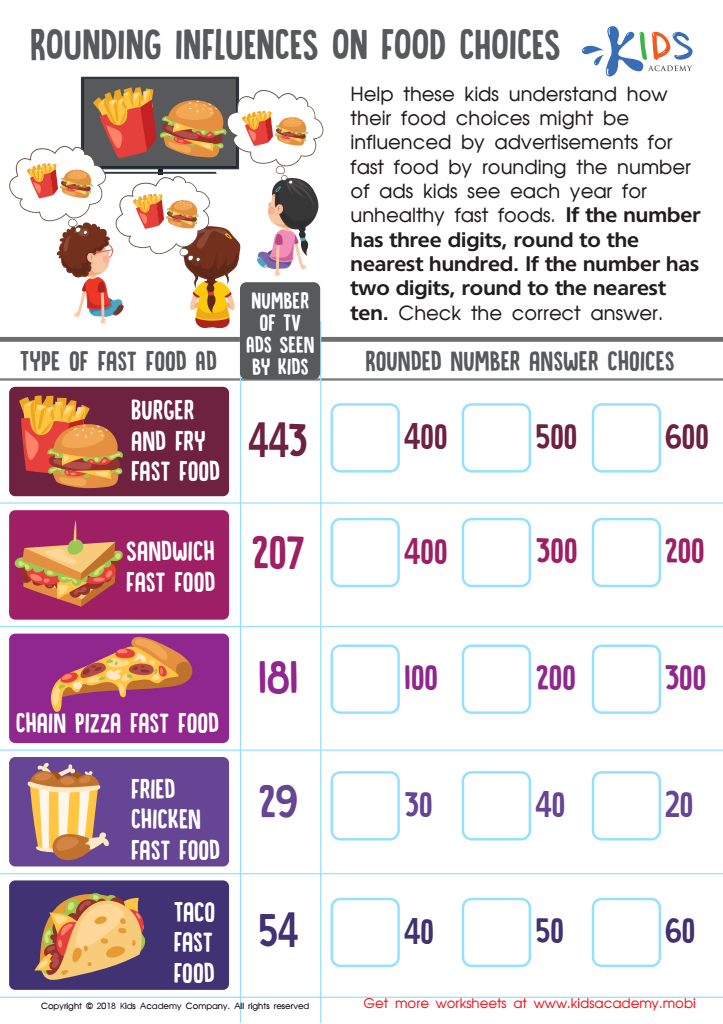
Rounding Influences Food Choices Worksheet

Interpret Line Plot Worksheet

Leaf Bar Graph Worksheet


Interpreting data in Grade 3 is crucial because it lays the foundation for critical thinking and analytical skills that children will use throughout their education and lives. For parents and teachers, the importance of this skill cannot be overstated.
Firstly, understanding how to interpret data helps children make sense of the world around them. It allows them to organize information, recognize patterns, and draw meaningful conclusions which are essential skills in everyday life. Whether they are comparing temperatures, tracking reading progress, or understanding basic statistics in sports, being able to interpret data is a practical and necessary ability.
Secondly, these skills are the building blocks of more complex mathematical and scientific concepts. As students advance to higher grades, they will encounter more intricate data sets and will need to make more critical evaluations. Having a solid grounding in data interpretation ensures they're prepared for these challenges.
Moreover, developing these skills can foster a child’s enthusiasm for learning. Activities involving data interpretation, such as class surveys or simple experiments, can be engaging and make learning fun. They also encourage curiosity and the scientific method of thinking—asking questions, forming hypotheses, and drawing conclusions based on evidence.
Finally, proficiency in interpreting data is linked to numeracy, a key component of overall literacy. In our increasingly data-driven world, being adept at understanding charts, graphs, and statistics empowers children to become informed adults who can make better decisions in their personal and professional lives.