Data interpretation Grade 3 Addition & Subtraction Worksheets
3 filtered results
-
From - To
Enhance your third grader's math skills with our engaging Data Interpretation Grade 3 Addition & Subtraction Worksheets. These expertly designed worksheets help young learners grasp essential data interpretation skills through real-world scenarios. By integrating addition and subtraction with data charts, graphs, and tables, students can build a solid foundation in both arithmetic and analytical thinking. Each worksheet offers a series of problems that encourage critical thinking and problem-solving. Perfect for classroom use or at-home practice, our worksheets ensure students develop the confidence and competence needed to excel in math. Start fostering a love for learning with Kids Academy today!
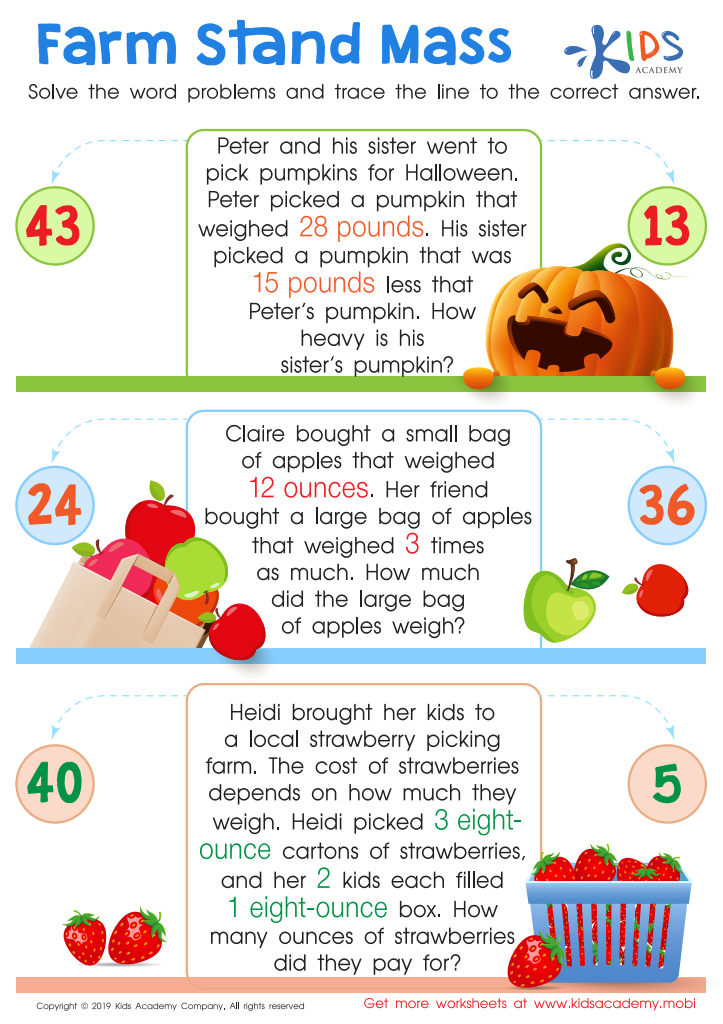

Farm Stand Mass Worksheet


Aircraft Carrier Picture Graphs Worksheet
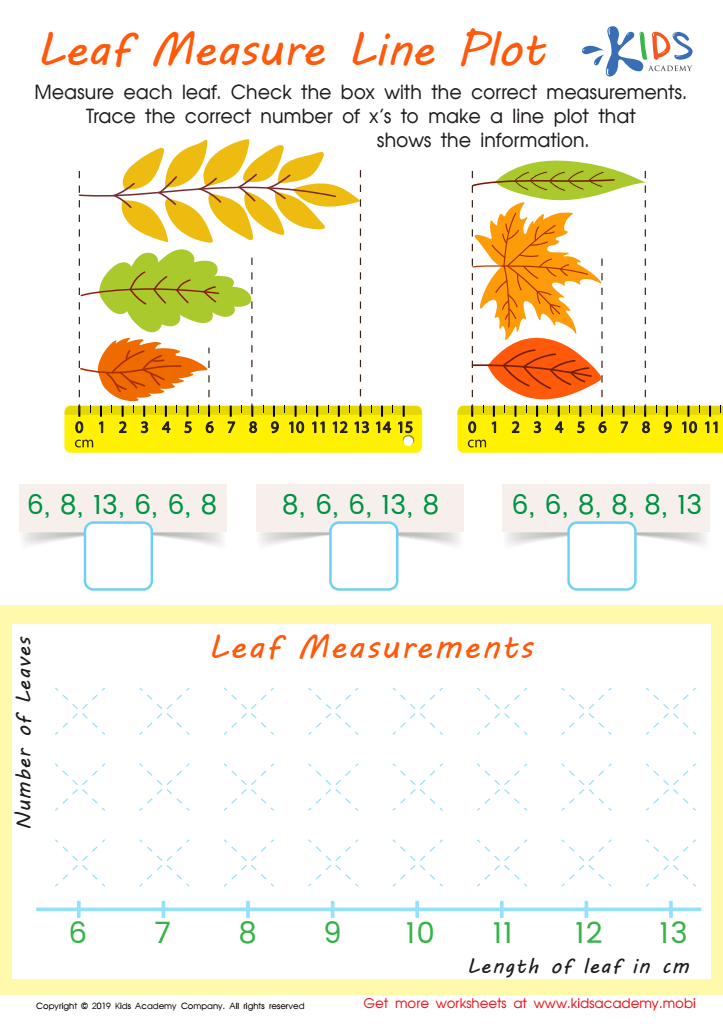

Leaf Measure Line Plot Worksheet
Parents and teachers should care about data interpretation in Grade 3 addition and subtraction because this foundational skill fosters critical thinking and problem-solving abilities in young learners. When students interpret data, they go beyond computational skills; they learn how to analyze information, make sense of numbers, and draw meaningful conclusions, which are crucial skills for future academic and real-world success.
Understanding how to interpret data within the context of addition and subtraction prepares students to handle more complex mathematical and statistical concepts as they progress through their education. It enhances their ability to comprehend word problems, assess the reasonableness of their answers, and utilize various strategies to find solutions efficiently. This not only boosts their confidence in math but also promotes a positive attitude towards learning.
Moreover, these skills extend beyond mathematics; they enhance logical reasoning and the capacity to make informed decisions, whether in science, social studies, or everyday life. For example, interpreting bar graphs or pictographs helps students understand trends and patterns, fostering a deeper comprehension of the world around them.
By emphasizing data interpretation in these core mathematical operations, parents and teachers can ensure that students develop a versatile skill set that empowers them to succeed academically and develop into thoughtful, analytical individuals.
 Assign to My Students


